From World-Class Asset Base, Barrick Hunts New Opportunities
The completion of major processing plant maintenance at Nevada Gold Mines, the conversion of the Goldstrike autoclave to a carbon-in-leach process, a much-improved performance from Turquoise Ridge and the steady ramp-up of throughput at Pueblo Viejo’s expanded plant will boost production in the second half of the year and keep Barrick on track to achieve its 2023 guidance, the company said today.
Reporting on the results for the first quarter, president and chief executive Mark Bristow said production, while lower than Q4 2022, was on plan, and free cash flow1 had still increased, demonstrating the value of Barrick’s Tier One2 asset portfolio. Net earnings per share for the quarter were $0.07, while adjusted net earnings per share3 were $0.14, and the quarterly dividend was maintained at $0.10 per share.
“At NGM, we have introduced a flatter and more responsive organizational structure and instilled the Barrick style of leadership in what is still a relatively new management team. Through this process, we have passed a major milestone in our journey to unlock Nevada’s full potential and strengthen its 15-year business plan,” he said.
“In the Dominican Republic, construction of Pueblo Viejo’s expanded process plant was 93% complete at the end of Q1 and we’re ramping up to full capacity by July. Currently our biggest growth project, it has been designed to extend the mine’s Tier One life to beyond 2040 at an expected average annual production rate of 800,000 ounces4 of gold.”
The development of another major project, Reko Diq in Pakistan, is also advancing steadily with continued progress on the updating of the feasibility study and the establishment of a Community Development Committee as well as a school. Scheduled to go into production in 2028, Reko Diq hosts one of the world’s largest undeveloped copper-gold deposits.
The Africa and Middle East region finished Q1 with gold production ahead of plan, setting the foundation for another year of delivery. At the Loulo-Gounkoto complex in Mali, the first high-grade stope at the new Gounkoto underground mine was successfully mined ahead of schedule.
At North Mara in Tanzania, mining has started at the new Gena open pit. During the quarter, Barrick committed $30 million to a new education initiative in partnership with the Tanzanian government.
“While we continue to build our peerless asset base, we are also casting our net wider and stepping up the hunt for fresh opportunities. During the past quarter, we have opened up new frontiers and secured multiple interesting prospects in Canada, the USA, Peru, the Dominican Republic, Saudi Arabia and Tanzania,” Bristow said.
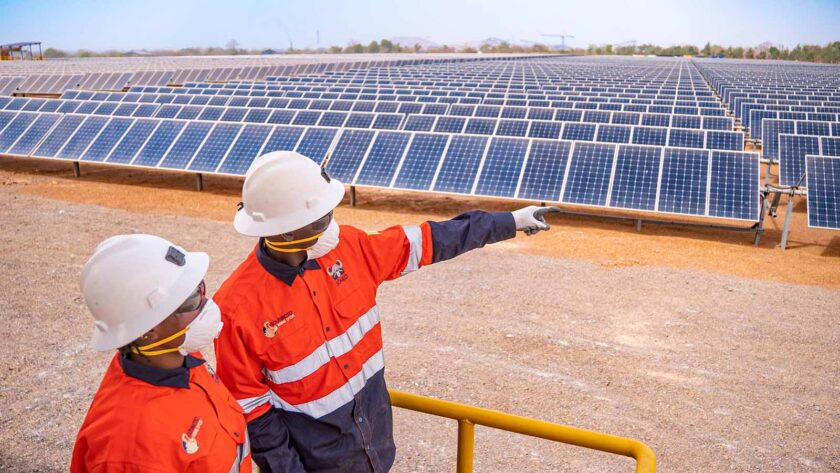
“We’re also maintaining our carefully planned transition to cleaner energy. In Nevada, work has started on the TS Power Plant’s natural gas co-fire project as well as the TS Solar project.
At Loulo, work is under way on the expansion of its solar plant and the addition of a battery storage system and at Kibali in the Democratic Republic of Congo (“DRC”), a battery back-up system for the three hydropower stations that supply the bulk of its energy is being planned.”
Bristow said Barrick’s consistent reserve replacement and resource growth has allowed it to underpin each operation and project with a fully planned 10+ year production profile.
This secures the generation of a robust free cash flow that consistently delivers strong returns to shareholders and enables Barrick to drive organic growth by investing in the development of its world-class assets.
Financial and Operating Highlights
| Financial Results | Q1 2023 | Q4 2022 | Q1 2022 | |
| Realized gold price5,6 ($ per ounce) | 1,902 | 1,728 | 1,876 | |
| Net earnings ($ millions) | 120 | (735 | ) | 438 |
| Adjusted net earnings3 ($ millions) | 247 | 220 | 463 | |
| Net cash provided by operating activities ($ millions) | 776 | 795 | 1,004 | |
| Free cash flow1 ($ millions) | 88 | (96 | ) | 393 |
| Net earnings per share ($) | 0.07 | (0.42 | ) | 0.25 |
| Adjusted net earnings per share3 ($) | 0.14 | 0.13 | 0.26 | |
| Attributable capital expenditures7,8 ($ millions) | 526 | 743 | 478 | |
| Operating Results | Q1 2023 | Q4 2022 | Q1 2022 | |
| Gold | ||||
| Production5 (000s of ounces) | 952 | 1,120 | 990 | |
| Cost of sales5,9 ($ per ounce) | 1,378 | 1,324 | 1,190 | |
| Total cash costs5,10 ($ per ounce) | 986 | 868 | 832 | |
| All-in sustaining costs5,10 ($ per ounce) | 1,370 | 1,242 | 1,164 | |
| Copper | ||||
| Production5 (millions of pounds) | 88 | 96 | 101 | |
| Cost of sales5,9 ($ per pound) | 3.22 | 3.19 | 2.21 | |
| C1 cash costs5,11 ($ per pound) | 2.71 | 2.25 | 1.81 | |
| All-in sustaining costs5,11 ($ per pound) | 3.40 | 3.98 | 2.85 | |
Key Performance Indicators
Best Assets
Q1 production in line with plan after planned maintenance at Nevada Gold Mines and start of plant commissioning at Pueblo Viejo
Pueblo Viejo and Nevada Gold Mines ramp up to drive a stronger second half in line with guidance
Robust performance from Turquoise Ridge driving year-on-year production increase
Pueblo Viejo’s expansion project continues to advance: SAG mill turning and first ore through the crusher as ramp-up starts
Gounkoto underground delivers first production stopes ahead of schedule
Resin-in-leach to carbon-in-leach conversion at the Goldstrike autoclave completed on time and on budget improving operational flexibility
Exploration team secures new projects in Canada, USA, Peru, Dominican Republic, Saudi Arabia, Tanzania
Leader in Sustainability
New global safety program ‘Journey to Zero’ launched
2022 Sustainability Report highlights Barrick’s contribution to achievement of United Nations Sustainable Development Goals
Reko Diq constitutes first Community Development Committee and opens Humai school
Barrick leads nationwide education initiative in Tanzania with $30 million commitment
Pueblo Viejo receives highest gender equality certification in Dominican Republic
Delivering Value
Free cash flow1 increased despite a lower production quarter
Net earnings per share of $0.07 and adjusted net earnings per share3 of $0.14 for the quarter
$0.10 per share dividend declared
Barrick Declares Q1 Dividend
Barrick yesterday announced the declaration of a dividend of $0.10 per share for the first quarter of 2023.
The dividend is consistent with the Company’s Performance Dividend Policy announced at the start of 2022 and will be paid on June 15, 2023 to shareholders of record at the close of business on May 31, 2023.
“Through the maintenance of a robust balance sheet, we are able to continue to provide a strong base dividend to our shareholders, with our Performance Dividend Policy providing shareholders with the potential for additional upside going forward,” said senior executive vice-president and chief financial officer Graham Shuttleworth.
Unlocking the Full Potential of the NGM District
Successful near-mine exploration at Nevada Gold Mines’ (“NGM”) Tier One operations is adding significant growth potential to its 15-year plan while NGM’s new management team is driving innovation and optimization of the company’s asset suite.
The Goldrush, Robertson and Cortez Hills mining projects will all bolster the Cortez complex, with further growth to come from Barrick’s wholly owned Fourmile project, which includes the new Dorothy target, and from Hanson, below the Cortez Hills underground mine.
Carlin is also well-endowed with opportunities, notably around the Leeville mine with expansion from Fallon, Miramar, Horsham and Upper Rita K. Other opportunities around the northern Carlin trend include upside from Ren and Corona. Turquoise Ridge is exploring the BBT corridor and Getchell, while at Phoenix, NGM is investigating the expansion of copper production at Copper Canyon.
The NGM team has identified three key innovation and optimization action areas: developing a pipeline of future leaders; focusing on further mining efficiencies; and increasing process throughput.
The NGM complex is a long-life business which needs to attract the best new-generation people for its future operations and leadership by providing opportunities that align with their career ambitions and their core values. Once recruited, they are developed through tailored leadership programs as well as NGM’s training mine.
NGM is investing $320 million12 in a fleet of 62 new trucks, to be delivered over the next three years, which is expected to de-risk and accelerate open pit mining. New portals at Pete Bajo and Rita K as well as at Ren will boost productivity and mineralization development, and a new paste plant at Goldstrike underground will increase paste capacity.
At Turquoise Ridge, the ramp-up of the recently commissioned Third Shaft continues to improve hoist capacity, mine production and ventilation.
The conversion from resin-in-leach to carbon-in-leach at the Goldstrike autoclave was completed during the first quarter, enabling the operation to process open pit material sooner from Carlin South.
The first phase of the Gold Quarry roaster expansion project was recently completed with the second and final phase scheduled for 2024. The overall project is expected to deliver around a 20% increase in throughput.
Massive Expansion Project Will Extend Pueblo Viejo’s Tier One Life Beyond 2040
Barrick’s $2.1 billion investment12 in the expansion of the Pueblo Viejo gold mine in the Dominican Republic — of which the process plant portion is now largely complete — is designed to deliver a totally transformed asset capable of ramping up production to an annual 1 million ounces and averaging 800,000 ounces per year over a life that is expected to extend to the 2040s.4
The reinvention of Pueblo Viejo is all the more remarkable says Mark Bristow, because at the time of the merger with Randgold in January 2019, the mine was facing closure: its vast resources could not be converted to reserves because it did not have the necessary tailings storage capacity.
“We tackled the mine’s challenges head-on. Chief among these was securing a site for a new tailings storage facility, which required lengthy consultation and negotiation with the regulatory authorities as well as the affected communities. Once the site was selected, we completed an Environmental and Social Impact Assessment in line with the government’s terms of reference, and we expect a decision towards the middle of this year,” Bristow said.
“Equally remarkable has been Pueblo Viejo’s steady upward trajectory, in the midst of the expansion project, in all other areas of its business. Despite having to manage multiple tie-ins, the team has achieved record throughput levels from 2019 to 2022.
At the same time, it has also been transitioning to a local and more diverse workforce, in line with Barrick’s global policy. It now has a 98% Dominican workforce with a female representation of 23%, up from 11% in 2019.”
Pueblo Viejo is the first Dominican mining company to be awarded the highest level of gender equality certification by the country’s Ministry of Women and the United Nations Development Programme, for three consecutive years.
Nor has its commitment to its host communities faltered, says Bristow. Eight community development committees have been formed in line with Barrick’s sustainability strategy.
Notable projects include the construction of the Zambrana medical clinic and the Sabana del Rey potable water treatment plant, the electrification of 21 rural villages and the establishment of an educational fund for scholars and students from the communities.
Pueblo Viejo is also continuing to reduce its greenhouse gas emissions through the conversion of its power plant and lime kiln to use liquid natural gas.
Building Barrick’s Next Leadership Generation
Barrick continues to invest in the development of a multicultural and multigenerational workforce aligned to a changing world.
The Group sources and trains a vast majority of its employees from its host countries in Africa, the Middle East, South and Central America, as well as in Canada and the United States.
Our diverse workforce is the product of Barrick’s strategy of local employment and stakeholder recognition in the countries in which we operate, says Mark Bristow: 96% of its workforce are host country or community hires, as are 78% of its management. The age profile is also trending younger, with 54% of employees now under the age of 40 and 17% younger than 30.
“Within each region, we have launched a comprehensive frontline development program that focuses on building appropriate business and leadership skills, ensuring consistency of competencies and aligning values with the Barrick DNA.
We are also building relationships with partner universities to provide us with a pipeline of talent well into the future,” says human resources executive Darian Rich.
Sustainable Delivery Centered on Achievement of UN Sustainable Development Goals
Barrick’s sustainability strategy is based on integrated and holistic management and aligned with the objectives of the United Nations’ Sustainable Development Goals (SDGs), that seeks to deliver outcomes that are achievable, demonstrable and align with global priorities, says Mark Bristow in the company’s 2022 Sustainability Report.
Bristow says by using the SDGs as the central framework of its sustainability reporting, Barrick is better able to link an integrated approach to sustainability management, and to avoid the siloed thinking and mere box-ticking approach that can be a consequence of taking an ESG compliance-driven approach.
Barrick’s latest Sustainability Report, its fifth since the merger with Randgold in 2019, still complies with important key reporting frameworks, but its primary lens for understanding and measuring its progress in sustainability aligns with a focus on the SDGs — an often-forgotten global commitment.
“Our sustainability approach allows us to tackle the challenges of alleviating poverty, managing changes to the climate and preserving biodiversity holistically and concurrently — because they are inextricably connected,” Bristow says.
For example, Barrick generated more than $10.7 billion12 in economic value and created 21,000 jobs in 2022 (SDG 8: Decent Work and Economic Growth). Additionally, 96% of its employees and 78% of its senior site managers are host country nationals, and $1.4 billion12 worth of goods and services were procured from suppliers in the communities closest to its mines. In total, Barrick spent over $6.1 billion12 on host country suppliers in 2022.
Barrick also invested more than $36 million12 in community development projects from education facilities in Nevada (SDG 4: Quality Education), to business incubators in the Dominican Republic (SDG 9: Industry, Innovation and Infrastructure) and gender-based violence awareness in Tanzania (SDG 5: Gender Equality). Barrick’s employees at Pueblo Viejo are now 23% women, with a target of 50% female representation for all new hires (SDG 5: Gender Equality and SDG 10: Reduced Inequality).
Pueblo Viejo is the first Dominican mining company to have been awarded the highest level of gender equality certification by the country’s Ministry of Women and the UN Development Programme.
On the environmental front, Barrick has set itself a greenhouse gas emissions reduction target that is both demonstrable and achievable (SDG 13: Climate Action).
The company’s total emissions in 2022 were 6,705kt CO2e (Scope 1 and 2: market-based), which is 6% lower compared to the year before and an 11% reduction against its 2018 baseline.
“For us, sustainability is instrumental in our continued drive to operate mines that are welcomed and respected as development partners throughout the world,” Bristow says.
Protecting Biodiversity: Barrick Leads the Way
Conserving biodiversity is fundamental to the survival of our world, essential to tackling climate change and has an important part to play in the war on poverty, says Barrick group sustainability executive Grant Beringer.
“We strive not only to protect and restore biodiversity within our permits, but also to partner with NGOs such as African Parks to make a positive contribution to nature in the countries in which we operate, some of which host unique but vulnerable ecosystems,” he says.
“To achieve this, we have committed Barrick, through our Biodiversity Policy and Standard, to have a net neutral impact on any key biodiversity features at our sites, as well as to take measurable conservation actions to help conserve high-value biodiversity sites in our host countries.”
Beringer cites Barrick’s partnership with the Garamba National Park and African Parks in the DRC as a prime example of its commitment to protecting nature as well as its holistic approach to sustainability.
Since 2015, Barrick has provided financial and in-kind support for a comprehensive conservation program designed to restore the park’s former megaherbivore abundance. The latest Barrick-sponsored initiative will see the return of white rhinos, last spotted there in 2006, to the park.
“Our engagement with Garamba also includes livelihood support for the communities that depend on it. In addition to its 500 employees, we have helped the park to provide economic opportunities for some 10,000 people through agricultural projects, while the four hospitals it supports treat more than 12,000 patients annually.”
In Nevada, Barrick has partnered with state and federal agencies, NGOs and local stakeholders to identify and implement projects to improve the ecosystem of the Great Basin. Among these is the rehabilitation of some 10,000 hectares of critically important habitat for sage grouse on the ranches owned by NGM.
In the Dominican Republic, Pueblo Viejo, in conjunction with the government, has identified the nearby Aniana Vargas National Park as a biodiversity offset site. The park shares most of its fauna and flora, as well as unique animals such as the Hutia rodent and the Samana least gecko, with the mine’s site.
At the Lumwana copper mine in Zambia, Barrick’s commitment to the implementation of the UN’s REDD+ project has advanced with the completion of an eligibility and feasibility study, and the project’s broad acceptance by the affected communities.
The project aims to conserve 530,000 hectares of woodland around the mine, which will benefit these communities through the creation of tourism, horticulture and beekeeping opportunities. It will also have the capacity to generate carbon credits aligned with Barrick’s hard-to-abate emissions strategy that can be used to offset hard-to-abate emissions, in line with Barrick’s Roadmap to Net Zero.
Continued Reserve Replacement and Disciplined Strategy Support 10-Year Growth Plan
Barrick last year again more than replaced the gold reserves it mined and its proven ability to sustain this achievement through exploration will support the execution of its 10-year rolling business plan, says executive chairman John Thornton.
“Attuned to the cyclicality of markets, Barrick’s strategy of building its future by continuing to invest in sustainably profitable growth, organic as well as external, has equipped us well to deal with challenging circumstances. In the current climate of uncertainty, we are proving again that our people are truly world class and are more than capable of making Barrick the world’s most valued gold and copper company,” he added.
“Our focus in 2023 will be on expanding Barrick’s value foundation, already one of the industry’s best, within and beyond our current borders.
The Reko Diq project in Pakistan will almost double our current copper production and will add to our gold production when it is fully operational.
We are also extending our presence in North and South America and we are particularly excited by new opportunities in North Africa and the Middle East.”
Thornton says that at a time when environmental management and human rights are coming under increasingly critical scrutiny, Barrick’s sustainability strategy has long been embedded in its business plans.
“The creation of long-term value for all stakeholders contributes meaningfully to the social and economic development of our host countries and communities, protects the safety and health of our people, respects human rights and manages the impact of our operations on the environment.
Sustainability performance accounts for 25% of the long-term incentive awards for our senior leaders, demonstrating the importance Barrick attaches to our sustainability commitments,” he says.
Barrick lead director Brett Harvey says that at a time when the mining industry’s recruitment pool is shrinking, Barrick actively seeks to attract talented young people by offering them exceptionally rewarding career opportunities in a modern, world-class business. By prioritizing local recruitment — 96% of Barrick’s global employees are host country nationals — the company has also built a workforce that is naturally multicultural and ethnically diverse.
Similarly, the Board represents a mosaic of skills, nationalities, racial and ethnic backgrounds and experiences and perspectives that is not only capable of directing Barrick effectively in a rapidly changing world, but also represents the composition of our stakeholder universe.
Barrick Steers Porgera Back Towards World-Class Production
The government of Papua New Guinea, Barrick Niugini Limited and New Porgera Limited have signed an agreement to progress with the resumption of operations at the Porgera gold mine, which have been suspended since 2020.12
Porgera hosts an orebody with measured and indicated resources of 10 million ounces14 and inferred resources of 3.4 million ounces.14 After the initial ramp up and optimization of the Wangima pit, the mine is forecast to produce an average of 700,000 ounces per year, achieving a milestone towards its potential Tier One status.
The New Porgera Progress Agreement, signed on March 31, confirms that all parties are committed to reopening the mine at the earliest opportunity, in line with the terms of the Porgera Project Commencement Agreement and the New Porgera Limited Shareholders Agreement, both concluded in 2022.
The New Porgera project team will now move ahead with the filings for a special mining lease and progressing the other conditions set out in the Commencement Agreement for the reopening of the mine.
The equity in New Porgera is shared 51% by Papua New Guinea (“PNG”) stakeholders, including local landowners and the Enga provincial government. Economic benefits will be shared 53% by the PNG stakeholders and 47% by Barrick Niugini Limited, which will operate the mine.
After the signing ceremony, Mark Bristow said there was strong support from all stakeholders to get Porgera reopened as soon as possible.
“It’s been a long journey but in the process we have secured the buy-in of all the stakeholders. For Barrick, the reopening of the mine would represent another victory for our host-country partnership model which has been so successful in Tanzania and has now also been adopted for the new Reko Diq copper-gold project in Pakistan,” Bristow said.
“Localization is an essential part of our partnership philosophy so New Porgera will, whenever possible, source the goods and services it requires from businesses genuinely based and owned in Porgera, the Enga province and PNG. Similarly, it will give preference to locals in recruiting employees for the reopening mine.”
Pioneering Kibali Plans Further Partner-Based Development
Since Kibali went into production 10 years ago, it has not only grown into Africa’s largest gold mine, it has also opened a new mining frontier in the DRC and stimulated the development of a thriving regional economy in the country’s north-east province.
Mark Bristow says the mutually beneficial partnership between the company and its local stakeholders, notably the government, contractors, service providers, employees and the community, has demonstrated that it is possible to build and operate a successful world-class mine, run by host country nationals, in one of Africa’s remotest corners.
In the 13 years since the acquisition of the property which became Kibali, it has invested more than $4.6 billion12 in the DRC, with payments to local contractors and suppliers alone amounting to almost $2.4 billion, $1.4 billion going to the government in the form of royalties, taxes and permits, salaries amounting to $621 million, and the investment of $196 million in infrastructure development and community support.
“Kibali has multiple partnerships with local businesses, many of which we have actively mentored, such as the all-Congolese team that built the mine’s Azambi hydropower station,” Bristow said.
“Kibali’s three continuously upgraded hydropower stations and their battery back-up system have put it in the lead of the Barrick group’s green energy drive. At present, approximately 80% of the mine’s power requirement is provided by renewable energy sources and this will rise when the planned new solar plant is commissioned in 2025, further reducing Kibali’s carbon footprint as well as its energy costs.”
The mine also continues to invest in the recruitment and training of Congolese nationals, who already account for 95% of its workforce and 76% of its leadership, with special emphasis on the skills development of potential managers and technicians.
Barrick Pledges $30 Million Towards School Development in Partnership With Tanzania
In a meeting between Mark Bristow and Tanzania president Samia Suluhu Hassan, the company affirmed its pledge of $30 million in partnership with the Tanzanian government, towards the expansion of education infrastructure in Tanzania.
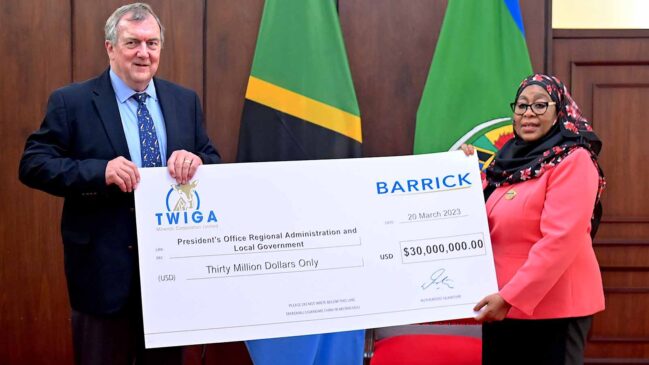
Called ‘The Barrick-Twiga Future Forward Education Program’, the objective is to build 1,090 classrooms, 1,640 ablution blocks and 270 dormitories across 161 schools nationwide, helping to accommodate approximately 49,000 of the estimated 190,000 students who are expected to start their A-levels in July this year. The first $10 million was committed in April and the balance will be rolled out with the program.
“We believe that education is key to the development of the country. Both the Bulyanhulu and North Mara gold mines continue to support the education sector through the building of classrooms and the improvement of education infrastructure around the mines, which has seen some of them consistently feature among the top schools in these regions,” Bristow said.
North Mara has already spent $1.9 million on 87 primary and secondary schools in the Tarime District, 14 of which are the best performing schools in the district. Bulyanhulu has spent $1.8 million on 80 educational projects around the mine and is currently building a Vocational Education Training College Centre in Bunango Village. Barrick’s investment around the mine has given 7,557 Tanzanian girls access to education in 2022.
“In addition to the company’s support of education, last year North Mara was officially recognized as Tanzania’s largest taxpayer and Bulyanhulu was awarded the Best Compliant Employer prize by the National Social Security Fund.
North Mara and Bulyanhulu also received the first and runner-up recognition awards, respectively, for the export of minerals and the generation of foreign currency.
They’ve both come a very long way and we look forward to continuing that journey through our Twiga partnership with the government.”
Bristow said since Barrick took over control of the mines in 2019, it had pumped $2.4 billion into the Tanzanian economy. Through their community development committees, the mines had invested more than $10 million in projects to improve healthcare, education, access to potable water and the road infrastructure.
Peerless Asset Quality and High-Potential Prospects Position Barrick for Profitable Growth
The past year marked a major milestone in Barrick’s journey to becoming the world’s most valued gold and copper mining company, with the foundational targets of the new business created by the merger with Randgold in January 2019 having largely been met, and its greater goals now within reach, says Mark Bristow with the recent publication of the company’s 2022 Annual Report.
“North America is Barrick’s value foundation and the true benefits of our creation of the NGM complex are now becoming evident in the form of mineral resource growth and new discoveries. The quality and prospectivity of its portfolio cannot be overstated,” he said.
“In Central America, the plant expansion project we initiated at the Pueblo Viejo gold mine in the Dominican Republic is rapidly taking shape. With its unlocked reserve base now standing at 20 million ounces15, the life of the mine — one of the six Tier One assets in our gold portfolio — has been extended beyond 2040 and it will maintain an average annual production rate above 800,000 ounces over that time.4
“Another of our Tier One assets, the Loulo-Gounkoto complex in Mali, which has produced more than 9 million ounces of gold since 2005, is set to maintain its current rate of production for the next 10 years, with its life extending to 203716.”
Bristow said Barrick was also achieving its strategic objective of significantly expanding its copper holdings. Work on the reconstituted Reko Diq project in Pakistan — one of the largest and highest quality undeveloped copper-gold deposits in the world — has started, and the revitalized Lumwana mine in Zambia has commenced a prefeasibility study on the Super Pit expansion. When both of these projects are completed in 2028, they will elevate Barrick into the front rank of copper producers.
“Brownfields exploration continues to unlock potential around our existing assets while greenfields work has started delivering real value. We’re continuing to expand our global exploration footprint with active programs elsewhere in North America as well as in Latin America, Saudi Arabia and Egypt,” he said.
“One of the highlights of last year was the continued growth in our gold reserves and resources, driven by our strategy of investing in organic growth through exploration and mineral resource management. Barrick’s ability over time to more than replace the ounces we mine reinforces our sustainability and our sector-leading production profile.”
Demonstrating its commitment to strong shareholder returns, Barrick returned a record $1.6 billion17 to shareholders last year, but this was not at the expense of its growth strategy, Bristow said.
“We continue to invest in and roll out our 10-year gold and copper plans, projecting real growth on a steady base-case production profile.
This investment is made possible by the unmatched quality of our assets and the abundant free cash flow they generate. Also embedded in our portfolio is a long pipeline of quality projects from which we are steadily unlocking value. The ability to grow without having to buy is a very significant advantage that differentiates Barrick from its peers,” he said.
In line with Barrick’s commitment to a ‘best people’ workforce, Bristow said Barrick is aggressively recruiting promising young professionals across all of the relevant disciplines.
The next generation of leaders is already taking shape in the company’s succession plans and last year already saw seamless transitions in a number of key positions.
It is also rapidly progressing the greening of its power grid across the group. Major solar projects in the Dominican Republic and Nevada, the expansion of solar power and the addition of a battery energy storage system at Loulo-Gounkoto, and the planned solar power dry season back-up for Kibali’s three hydropower plants, will not only significantly advance Barrick towards its 2050 net zero target, but will improve the mines’ margins by pruning energy costs.
Also in the annual report, executive chairman John Thornton noted the significant contribution Barrick’s operations make in the developing countries in which it operates.
“Mining can and should be a key catalyst for economic growth and social upliftment. Barrick’s substantial contribution to our host countries’ coffers and our equally significant investment in the welfare of the communities that border on our mines is making a real difference, highlighting the important part the mining industry can play in narrowing the gap between the richer and poorer nations to make the world a better place,” he said.
Mali Operations Honored by Government for Tax Citizenship
Barrick’s Loulo-Gounkoto gold mining complex, as one of the largest taxpayers in Mali, has been formally thanked by the government for its role in enabling the tax department to achieve its revenue targets for 2022.
In a ceremony at Barrick’s Bamako office, the country’s director of large enterprises presented both Loulo and Gounkoto with certificates of recognition honoring what was described as their high level of tax citizenship and expressing the hope that this productive partnership between the mines and the government would continue.
Barrick, through its legacy company Randgold, has been operating in Mali for more than a quarter of a century and during that time, we have contributed to the development of the country’s economy and its mining industry.
A First for Water Treatment in San Juan
The community of Iglesia near the Veladero mine in San Juan, Argentina, has become the first municipality in the province to use alternative energy to power its drinking water treatment plants.
Solar energy will power the plants’ pumps and operate the filtering equipment, sending water from wells to reserve tanks.
“This system will reduce our electricity expense by 50% to 60%, which is a huge savings,” says Oscar Varela, president of the Rodeo Neighborhood Association.
Two photovoltaic kits of 12 horsepower with 32 panels generating 9.9 kilowatts, and one 17 horsepower kit comprising 60 panels of 18.6 kilowatts, were built in the Rodeo and Bella Vista water treatment plants. In case of any power failure in the panels, the plants are automatically reconnected to the power grid.
“The idea of powering the water treatment plants with solar energy is an innovation that emerged as we have been working to refurbish a total of ten plants in the region over the last three years,” said Veladero’s sustainable development manager, Alberto Abecasis.
The effort was a collaboration between Veladero, neighborhood associations, the Municipality of Iglesia and the Ministry of Mining.
The mine and its neighbors have also collaborated in environmental participatory monitoring. Over the past few months, five monitoring sessions that had 21 community members collect water samples at Veladero’s compliance points and submit them to a certified lab for testing, has confirmed water quality meets all baseline parameters.
Barrick organizes participatory monitoring sessions like these at several operations worldwide to ensure that our host communities understand what we are doing to make sure we are responsible stewards of the environment.
2023 Operating and Capital Expenditure Guidance
| GOLD PRODUCTION AND COSTS | ||||
| 2023 forecast attributable production (000s oz) | 2023 forecast cost of sales9 ($/oz) | 2023 forecast total cash costs10 ($/oz) | 2023 forecast all-in sustaining costs10 ($/oz) | |
| Carlin (61.5%) | 910 – 1,000 | 1,030 – 1,110 | 820 – 880 | 1,250 – 1,330 |
| Cortez (61.5%)18 | 580 – 650 | 1,080 – 1,160 | 680 – 740 | 930 – 1,010 |
| Turquoise Ridge (61.5%) | 300 – 340 | 1,290 – 1,370 | 900 – 960 | 1,170 – 1,250 |
| Phoenix (61.5%) | 100 – 120 | 1,860 – 1,940 | 880 – 940 | 1,110 – 1,190 |
| Long Canyon (61.5%) | 0 – 10 | 2,120 – 2,200 | 730 – 790 | 1,080 – 1,160 |
| Nevada Gold Mines (61.5%) | 1,900 – 2,100 | 1,140 – 1,220 | 790 – 850 | 1,140 – 1,220 |
| Hemlo | 150 – 170 | 1,400 – 1,480 | 1,210 – 1,270 | 1,590 – 1,670 |
| North America | 2,100 – 2,300 | 1,160 – 1,240 | 820 – 880 | 1,170 – 1,250 |
| Pueblo Viejo (60%) | 470 – 520 | 1,130 – 1,210 | 710 – 770 | 960 – 1,040 |
| Veladero (50%) | 160 – 180 | 1,630 – 1,710 | 1,060 – 1,120 | 1,550 – 1,630 |
| Porgera (47.5%)13 | — | — | — | — |
| Latin America & Asia Pacific | 630 – 700 | 1,260 – 1,340 | 800 – 860 | 1,110 – 1,190 |
| Loulo-Gounkoto (80%) | 510 – 560 | 1,100 – 1,180 | 750 – 810 | 1,070 – 1,150 |
| Kibali (45%) | 320 – 360 | 1,080 – 1,160 | 710 – 770 | 880 – 960 |
| North Mara (84%) | 230 – 260 | 1,120 – 1,200 | 900 – 960 | 1,240 – 1,320 |
| Bulyanhulu (84%) | 160 – 190 | 1,230 – 1,310 | 880 – 940 | 1,160 – 1,240 |
| Tongon (89.7%) | 180 – 210 | 1,260 – 1,340 | 1,070 – 1,130 | 1,240 – 1,320 |
| Africa & Middle East | 1,450 – 1,600 | 1,130 – 1,210 | 820 – 880 | 1,080 – 1,160 |
| Total Attributable to Barrick19,20,21 | 4,200 – 4,600 | 1,170 – 1,250 | 820 – 880 | 1,170 – 1,250 |
| COPPER PRODUCTION AND COSTS | ||||
| 2023 forecast attributable production (Mlbs) | 2023 forecast cost of sales9($/lb) | 2023 forecast C1 cash costs11($/lb) | 2023 forecast all-in sustaining costs11($/lb) | |
| Lumwana | 260 – 290 | 2.45 – 2.75 | 2.00 – 2.20 | 3.20 – 3.50 |
| Zaldívar (50%) | 100 – 110 | 3.40 – 3.70 | 2.60 – 2.80 | 2.90 – 3.20 |
| Jabal Sayid (50%) | 65 – 75 | 1.80 – 2.10 | 1.50 – 1.70 | 1.60 – 1.90 |
| Total Attributable to Barrick21 | 420 – 470 | 2.60 – 2.90 | 2.05 – 2.25 | 2.95 – 3.25 |
| ATTRIBUTABLE CAPITAL EXPENDITURES | ||||
| ($ millions) | ||||
| Attributable minesite sustaining7 | 1,450 – 1,700 | |||
| Attributable project7 | 750 – 900 | |||
| Total attributable capital expenditures | 2,200 – 2,600 | |||
2023 Outlook Assumptions and Economic Sensitivity Analysis
| 2023 Guidance Assumption | Hypothetical Change | Impact on EBITDA22 (millions) | Impact on TCC and AISC10,11 | |
| Gold price sensitivity | $1,650/oz | +/- $100/oz | +/- $590 | +/- $5/oz |
| Copper price sensitivity | $3.50/lb | +/- $0.25/lb | +/- $110 | +/- $0.01/lb |
Production and Cost Summary – Gold
| For the three months ended | ||||||||||||||
| 3/31/23 | 12/31/22 | % Change | 3/31/22 | % Change | ||||||||||
| Nevada Gold Mines LLC (61.5%)a | ||||||||||||||
| Gold produced (000s oz attributable basis) | 416 | 516 | (19 | )% | 459 | (9 | )% | |||||||
| Gold produced (000s oz 100% basis) | 676 | 838 | (19 | )% | 747 | (9 | )% | |||||||
| Cost of sales ($/oz) | 1,461 | 1,257 | 16 | % | 1,169 | 25 | % | |||||||
| Total cash costs ($/oz)b | 1,074 | 906 | 19 | % | 820 | 31 | % | |||||||
| All-in sustaining costs ($/oz)b | 1,436 | 1,179 | 22 | % | 1,118 | 28 | % | |||||||
| Carlin (61.5%)c | ||||||||||||||
| Gold produced (000s oz attributable basis) | 166 | 265 | (37 | )% | 229 | (28 | )% | |||||||
| Gold produced (000s oz 100% basis) | 270 | 432 | (37 | )% | 373 | (28 | )% | |||||||
| Cost of sales ($/oz) | 1,449 | 1,081 | 34 | % | 1,015 | 43 | % | |||||||
| Total cash costs ($/oz)b | 1,215 | 878 | 38 | % | 829 | 47 | % | |||||||
| All-in sustaining costs ($/oz)b | 1,689 | 1,217 | 39 | % | 1,139 | 48 | % | |||||||
| Cortez (61.5%)c | ||||||||||||||
| Gold produced (000s oz attributable basis) | 140 | 140 | 0 | % | 115 | 22 | % | |||||||
| Gold produced (000s oz 100% basis) | 226 | 226 | 0 | % | 187 | 22 | % | |||||||
| Cost of sales ($/oz) | 1,324 | 1,284 | 3 | % | 1,113 | 19 | % | |||||||
| Total cash costs ($/oz)b | 913 | 848 | 8 | % | 784 | 16 | % | |||||||
| All-in sustaining costs ($/oz)b | 1,233 | 1,037 | 19 | % | 1,150 | 7 | % | |||||||
| Turquoise Ridge (61.5%) | ||||||||||||||
| Gold produced (000s oz attributable basis) | 81 | 78 | 4 | % | 67 | 21 | % | |||||||
| Gold produced (000s oz 100% basis) | 131 | 127 | 4 | % | 109 | 21 | % | |||||||
| Cost of sales ($/oz) | 1,412 | 1,518 | (7 | )% | 1,436 | (2 | )% | |||||||
| Total cash costs ($/oz)b | 1,034 | 1,089 | (5 | )% | 1,030 | 0 | % | |||||||
| All-in sustaining costs ($/oz)b | 1,271 | 1,304 | (3 | )% | 1,281 | (1 | )% | |||||||
| Phoenix (61.5%) | ||||||||||||||
| Gold produced (000s oz attributable basis) | 27 | 30 | (10 | )% | 23 | 17 | % | |||||||
| Gold produced (000s oz 100% basis) | 45 | 48 | (10 | )% | 37 | 17 | % | |||||||
| Cost of sales ($/oz) | 2,380 | 1,901 | 25 | % | 2,253 | 6 | % | |||||||
| Total cash costs ($/oz)b | 1,198 | 946 | 27 | % | 835 | 43 | % | |||||||
| All-in sustaining costs ($/oz)b | 1,365 | 1,037 | 32 | % | 1,027 | 33 | % | |||||||
| Long Canyon (61.5%) | ||||||||||||||
| Gold produced (000s oz attributable basis) | 2 | 3 | (33 | )% | 25 | (92 | )% | |||||||
| Gold produced (000s oz 100% basis) | 4 | 5 | (33 | )% | 41 | (92 | )% | |||||||
| Cost of sales ($/oz) | 1,621 | 1,812 | (11 | )% | 1,093 | 48 | % | |||||||
| Total cash costs ($/oz)b | 579 | 616 | (6 | )% | 342 | 69 | % | |||||||
| All-in sustaining costs ($/oz)b | 629 | 664 | (5 | )% | 366 | 72 | % | |||||||
| Pueblo Viejo (60%) | ||||||||||||||
| Gold produced (000s oz attributable basis) | 89 | 98 | (9 | )% | 104 | (14 | )% | |||||||
| Gold produced (000s oz 100% basis) | 149 | 163 | (9 | )% | 174 | (14 | )% | |||||||
| Cost of sales ($/oz) | 1,241 | 1,215 | 2 | % | 1,077 | 15 | % | |||||||
| Total cash costs ($/oz)b | 714 | 764 | (7 | )% | 682 | 5 | % | |||||||
| All-in sustaining costs ($/oz)b | 1,073 | 1,065 | 1 | % | 948 | 13 | % | |||||||
| Loulo-Gounkoto (80%) | ||||||||||||||
| Gold produced (000s oz attributable basis) | 137 | 139 | (1 | )% | 138 | (1 | )% | |||||||
| Gold produced (000s oz 100% basis) | 172 | 174 | (1 | )% | 172 | (1 | )% | |||||||
| Cost of sales ($/oz) | 1,275 | 1,216 | 5 | % | 1,088 | 17 | % | |||||||
| Total cash costs ($/oz)b | 855 | 822 | 4 | % | 721 | 19 | % | |||||||
| All-in sustaining costs ($/oz)b | 1,190 | 1,102 | 8 | % | 982 | 21 | % | |||||||
| Kibali (45%) | ||||||||||||||
| Gold produced (000s oz attributable basis) | 64 | 97 | (34 | )% | 76 | (16 | )% | |||||||
| Gold produced (000s oz 100% basis) | 141 | 216 | (34 | )% | 168 | (16 | )% | |||||||
| Cost of sales ($/oz) | 1,367 | 1,570 | (13 | )% | 1,137 | 20 | % | |||||||
| Total cash costs ($/oz)b | 987 | 617 | 60 | % | 744 | 33 | % | |||||||
| All-in sustaining costs ($/oz)b | 1,177 | 981 | 20 | % | 996 | 18 | % | |||||||
| Veladero (50%) | ||||||||||||||
| Gold produced (000s oz attributable basis) | 43 | 50 | (14 | )% | 46 | (7 | )% | |||||||
| Gold produced (000s oz 100% basis) | 86 | 99 | (14 | )% | 92 | (7 | )% | |||||||
| Cost of sales ($/oz) | 1,587 | 2,309 | (31 | )% | 1,348 | 18 | % | |||||||
| Total cash costs ($/oz)b | 1,035 | 954 | 8 | % | 847 | 22 | % | |||||||
| All-in sustaining costs ($/oz)b | 1,761 | 1,526 | 15 | % | 1,588 | 11 | % | |||||||
| Porgera (47.5%)d | ||||||||||||||
| Gold produced (000s oz attributable basis) | — | — | — | % | — | — | % | |||||||
| Gold produced (000s oz 100% basis) | — | — | — | % | — | — | % | |||||||
| Cost of sales ($/oz) | — | — | — | % | — | — | % | |||||||
| Total cash costs ($/oz)b | — | — | — | % | — | — | % | |||||||
| All-in sustaining costs ($/oz)b | — | — | — | % | — | — | % | |||||||
| Tongon (89.7%) | ||||||||||||||
| Gold produced (000s oz attributable basis) | 50 | 63 | (21 | )% | 35 | 43 | % | |||||||
| Gold produced (000s oz 100% basis) | 55 | 70 | (21 | )% | 39 | 43 | % | |||||||
| Cost of sales ($/oz) | 1,453 | 1,381 | 5 | % | 2,036 | (29 | )% | |||||||
| Total cash costs ($/oz)b | 1,182 | 1,070 | 10 | % | 1,667 | (29 | )% | |||||||
| All-in sustaining costs ($/oz)b | 1,284 | 1,404 | (9 | )% | 1,803 | (29 | )% | |||||||
| Hemlo | ||||||||||||||
| Gold produced (000s oz) | 41 | 38 | 8 | % | 31 | 32 | % | |||||||
| Cost of sales ($/oz) | 1,486 | 1,451 | 2 | % | 1,727 | (14 | )% | |||||||
| Total cash costs ($/oz)b | 1,291 | 1,227 | 5 | % | 1,503 | (14 | )% | |||||||
| All-in sustaining costs ($/oz)b | 1,609 | 1,557 | 3 | % | 1,982 | (19 | )% | |||||||
| North Mara (84%) | ||||||||||||||
| Gold produced (000s oz attributable basis) | 68 | 70 | (3 | )% | 56 | 21 | % | |||||||
| Gold produced (000s oz 100% basis) | 81 | 84 | (3 | )% | 66 | 21 | % | |||||||
| Cost of sales ($/oz) | 987 | 1,030 | (4 | )% | 852 | 16 | % | |||||||
| Total cash costs ($/oz)b | 759 | 758 | 0 | % | 709 | 7 | % | |||||||
| All-in sustaining costs ($/oz)b | 1,137 | 1,301 | (13 | )% | 874 | 30 | % | |||||||
| Bulyanhulu (84%) | ||||||||||||||
| Gold produced (000s oz attributable basis) | 44 | 49 | (10 | )% | 45 | (2 | )% | |||||||
| Gold produced (000s oz 100% basis) | 53 | 58 | (10 | )% | 53 | (2 | )% | |||||||
| Cost of sales ($/oz) | 1,358 | 1,237 | 10 | % | 1,216 | 12 | % | |||||||
| Total cash costs ($/oz)b | 982 | 896 | 10 | % | 847 | 16 | % | |||||||
| All-in sustaining costs ($/oz)b | 1,332 | 1,401 | (5 | )% | 984 | 35 | % | |||||||
| Total Attributable to Barricke | ||||||||||||||
| Gold produced (000s oz) | 952 | 1,120 | (15 | )% | 990 | (4 | )% | |||||||
| Cost of sales ($/oz)f | 1,378 | 1,324 | 4 | % | 1,190 | 16 | % | |||||||
| Total cash costs ($/oz)b | 986 | 868 | 14 | % | 832 | 19 | % | |||||||
| All-in sustaining costs ($/oz)b | 1,370 | 1,242 | 10 | % | 1,164 | 18 | % | |||||||
These results represent the 61.5% interest in Carlin, Cortez, Turquoise Ridge, Phoenix and Long Canyon.
Further information on these non-GAAP financial performance measures, including detailed reconciliations, is included in the endnotes to this press release.
includes Goldrush.
As Porgera was placed on care and maintenance on April 25, 2020, no operating data or per ounce data is provided.
Excludes Pierina, which is producing incidental ounces while in closure.
Gold cost of sales per ounce is calculated as cost of sales across our gold operations (excluding sites in closure or care and maintenance) divided by ounces sold (both on an attributable basis using Barrick’s ownership share).
Production and Cost Summary – Copper
| For the three months ended | |||||||
| 3/31/23 | 12/31/22 | % Change | 3/31/22 | % Change | |||
| Lumwana | |||||||
| Copper production (Mlbs) | 48 | 53 | (9 | )% | 57 | (16 | )% |
| Cost of sales ($/lb) | 3.56 | 3.56 | 0 | % | 2.20 | 62 | % |
| C1 cash costs ($/lb)a | 3.09 | 2.34 | 32 | % | 1.86 | 66 | % |
| All-in sustaining costs ($/lb)a | 3.98 | 4.86 | (18 | )% | 3.16 | 26 | % |
| Zaldívar (50%) | |||||||
| Copper production (Mlbs attributable basis) | 22 | 25 | (12 | )% | 25 | (12 | )% |
| Copper production (Mlbs 100% basis) | 44 | 50 | (12 | )% | 51 | (12 | )% |
| Cost of sales ($/lb) | 3.73 | 3.55 | 5 | % | 2.85 | 31 | % |
| C1 cash costs ($/lb)a | 2.86 | 2.69 | 6 | % | 2.15 | 33 | % |
| All-in sustaining costs ($/lb)a | 3.22 | 3.60 | (11 | )% | 2.64 | 22 | % |
| Jabal Sayid (50%) | |||||||
| Copper production (Mlbs attributable basis) | 18 | 18 | 0 | % | 19 | (5 | )% |
| Copper production (Mlbs 100% basis) | 37 | 36 | 0 | % | 38 | (5 | )% |
| Cost of sales ($/lb) | 1.53 | 1.72 | (11 | )% | 1.30 | 18 | % |
| C1 cash costs ($/lb)a | 1.39 | 1.42 | (2 | )% | 1.10 | 26 | % |
| All-in sustaining costs ($/lb)a | 1.61 | 1.54 | 5 | % | 1.17 | 38 | % |
| Total Attributable to Barrick | |||||||
| Copper production (Mlbs) | 88 | 96 | (8 | )% | 101 | (13 | )% |
| Cost of sales ($/lb)b | 3.22 | 3.19 | 1 | % | 2.21 | 46 | % |
| C1 cash costs ($/lb)a | 2.71 | 2.25 | 20 | % | 1.81 | 50 | % |
| All-in sustaining costs ($/lb)a | 3.40 | 3.98 | (15 | )% | 2.85 | 19 | % |
Copper cost of sales per pound is calculated as cost of sales across the copper operations divided by pounds sold (both on an attributable basis using Barrick’s ownership share).
Financial and Operating Highlights
| For the three months ended | |||||||||||
| 3/31/23 | 12/31/22 | % Change | 3/31/22 | % Change | |||||||
| Financial Results ($ millions) | |||||||||||
| Revenues | 2,643 | 2,774 | (5 | )% | 2,853 | (7 | )% | ||||
| Cost of sales | 1,941 | 2,093 | (7 | )% | 1,739 | 12 | % | ||||
| Net earningsa | 120 | (735 | ) | 116 | % | 438 | (73 | )% | |||
| Adjusted net earningsb | 247 | 220 | 12 | % | 463 | (47 | )% | ||||
| Adjusted EBITDAb | 1,183 | 1,286 | (8 | )% | 1,645 | (28 | )% | ||||
| Adjusted EBITDA marginc | 45 | % | 46 | % | (2 | )% | 58 | % | (22 | )% | |
| Minesite sustaining capital expendituresb,d | 454 | 557 | (18 | )% | 420 | 8 | % | ||||
| Project capital expendituresb,d | 226 | 324 | (30 | )% | 186 | 22 | % | ||||
| Total consolidated capital expendituresd,e | 688 | 891 | (23 | )% | 611 | 13 | % | ||||
| Net cash provided by operating activities | 776 | 795 | (2 | )% | 1,004 | (23 | )% | ||||
| Net cash provided by operating activities marginf | 29 | % | 29 | % | 0 | % | 35 | % | (17 | )% | |
| Free cash flowb | 88 | (96 | ) | 192 | % | 393 | (78 | )% | |||
| Net earnings per share (basic and diluted) | 0.07 | (0.42 | ) | 117 | % | 0.25 | (72 | )% | |||
| Adjusted net earnings (basic)b per share | 0.14 | 0.13 | 8 | % | 0.26 | (46 | )% | ||||
| Weighted average diluted common shares (millions of shares) | 1,755 | 1,759 | 0 | % | 1,779 | (1 | )% | ||||
| Operating Results | |||||||||||
| Gold production (thousands of ounces)g | 952 | 1,120 | (15 | )% | 990 | (4 | )% | ||||
| Gold sold (thousands of ounces)g | 954 | 1,111 | (14 | )% | 993 | (4 | )% | ||||
| Market gold price ($/oz) | 1,890 | 1,726 | 10 | % | 1,877 | 1 | % | ||||
| Realized gold priceb,g ($/oz) | 1,902 | 1,728 | 10 | % | 1,876 | 1 | % | ||||
| Gold cost of sales (Barrick’s share)g,h ($/oz) | 1,378 | 1,324 | 4 | % | 1,190 | 16 | % | ||||
| Gold total cash costsb,g ($/oz) | 986 | 868 | 14 | % | 832 | 19 | % | ||||
| Gold all-in sustaining costsb,g ($/oz) | 1,370 | 1,242 | 10 | % | 1,164 | 18 | % | ||||
| Copper production (millions of pounds)g | 88 | 96 | (8 | )% | 101 | (13 | )% | ||||
| Copper sold (millions of pounds)g | 89 | 99 | (10 | )% | 113 | (21 | )% | ||||
| Market copper price ($/lb) | 4.05 | 3.63 | 12 | % | 4.53 | (11 | )% | ||||
| Realized copper priceb,g ($/lb) | 4.20 | 3.81 | 10 | % | 4.68 | (10 | )% | ||||
| Copper cost of sales (Barrick’s share)g,i ($/lb) | 3.22 | 3.19 | 1 | % | 2.21 | 46 | % | ||||
| Copper C1 cash costsb,g ($/lb) | 2.71 | 2.25 | 20 | % | 1.81 | 50 | % | ||||
| Copper all-in sustaining costsb,g ($/lb) | 3.40 | 3.98 | (15 | )% | 2.85 | 19 | % | ||||
| As at 3/31/23 | As at 12/31/22 | % Change | As at 3/31/22 | % Change | |||||||
| Financial Position ($ millions) | |||||||||||
| Debt (current and long-term) | 4,777 | 4,782 | 0 | % | 5,144 | (7 | )% | ||||
| Cash and equivalents | 4,377 | 4,440 | (1 | )% | 5,887 | (26 | )% | ||||
| Debt, net of cash | 400 | 342 | 17 | % | (743 | ) | 154 | % | |||
Net earnings represents net earnings attributable to the equity holders of the Company.
Further information on these non-GAAP financial performance measures, including detailed reconciliations, is included in the endnotes to this press release.
Represents adjusted EBITDA divided by revenue.
Amounts presented on a consolidated cash basis. Project capital expenditures are included in our calculation of all-in costs, but not included in our calculation of all-in sustaining costs.
Total consolidated capital expenditures also includes capitalized interest of $8 million for the three month period ended March 31, 2023 (December 31, 2022: $10 million and March 31, 2022: $5 million).
Represents net cash provided by operating activities divided by revenue.
On an attributable basis.
Gold cost of sales per ounce is calculated as cost of sales across our gold operations (excluding sites in closure or care and maintenance) divided by ounces sold (both on an attributable basis using Barrick’s ownership share).
Copper cost of sales per pound is calculated as cost of sales across our copper operations divided by pounds sold (both on an attributable basis using Barrick’s ownership share).
Consolidated Statements of Income
| Barrick Gold Corporation (in millions of United States dollars, except per share data) (Unaudited) | Three months ended March 31, | |||||
| 2023 | 2022 | |||||
| Revenue (notes 4 and 5) | $2,643 | $2,853 | ||||
| Costs and expenses (income) | ||||||
| Cost of sales (notes 4 and 6) | 1,941 | 1,739 | ||||
| General and administrative expenses | 39 | 54 | ||||
| Exploration, evaluation and project expenses | 71 | 67 | ||||
| Impairment charges (notes 8b and 12) | 1 | 2 | ||||
| Loss on currency translation | 38 | 3 | ||||
| Closed mine rehabilitation | 22 | 3 | ||||
| Income from equity investees (note 11) | (53 | ) | (99 | ) | ||
| Other expense (income) (note 8a) | 52 | (11 | ) | |||
| Income before finance costs and income taxes | $532 | $1,095 | ||||
| Finance costs, net | (58 | ) | (88 | ) | ||
| Income before income taxes | $474 | $1,007 | ||||
| Income tax expense (note 9) | (205 | ) | (301 | ) | ||
| Net income | $269 | $706 | ||||
| Attributable to: | ||||||
| Equity holders of Barrick Gold Corporation | $120 | $438 | ||||
| Non-controlling interests (note 15) | $149 | $268 | ||||
| Earnings per share data attributable to the equity holders of Barrick Gold Corporation (note 7) | ||||||
| Net income | ||||||
| Basic | $0.07 | $0.25 | ||||
| Diluted | $0.07 | $0.25 | ||||
Consolidated Statements of Comprehensive Income
| Barrick Gold Corporation (in millions of United States dollars) (Unaudited) | Three months ended March 31, | |||||
| 2023 | 2022 | |||||
| Net income | $269 | $706 | ||||
| Other comprehensive income (loss), net of taxes | ||||||
| Items that may be reclassified subsequently to profit or loss: | ||||||
| Currency translation adjustments, net of tax $nil and $nil | (3 | ) | — | |||
| Items that will not be reclassified to profit or loss: | ||||||
| Net change on equity investments, net of tax $nil and ($8) | — | 58 | ||||
| Total other comprehensive (loss) income | (3 | ) | 58 | |||
| Total comprehensive income | $266 | $764 | ||||
| Attributable to: | ||||||
| Equity holders of Barrick Gold Corporation | $117 | $496 | ||||
| Non-controlling interests | $149 | $268 | ||||
Consolidated Statements of Cash Flow
| Barrick Gold Corporation (in millions of United States dollars) (Unaudited) | Three months ended March 31, | |||||
| 2023 | 2022 | |||||
| OPERATING ACTIVITIES | ||||||
| Net income | $269 | $706 | ||||
| Adjustments for the following items: | ||||||
| Depreciation | 495 | 460 | ||||
| Finance costs, net1 | 58 | 88 | ||||
| Impairment charges (notes 8b and 12) | 1 | 2 | ||||
| Income tax expense (note 9) | 205 | 301 | ||||
| Income from equity investees (note 11) | (53 | ) | (99 | ) | ||
| Gain on sale of non-current assets | (3 | ) | (2 | ) | ||
| Loss on currency translation | 38 | 3 | ||||
| Change in working capital (note 10) | (206 | ) | (131 | ) | ||
| Other operating activities (note 10) | 52 | (77 | ) | |||
| Operating cash flows before interest and income taxes | 856 | 1,251 | ||||
| Interest paid | (23 | ) | (23 | ) | ||
| Interest received1 | 49 | 10 | ||||
| Income taxes paid2 | (106 | ) | (234 | ) | ||
| Net cash provided by operating activities | 776 | 1,004 | ||||
| INVESTING ACTIVITIES | ||||||
| Property, plant and equipment | ||||||
| Capital expenditures (note 4) | (688 | ) | (611 | ) | ||
| Sales proceeds | 3 | 1 | ||||
| Investment sales | — | 260 | ||||
| Dividends received from equity method investments (note 11) | 67 | 359 | ||||
| Net cash provided by (used in) investing activities | (618 | ) | 9 | |||
| FINANCING ACTIVITIES | ||||||
| Lease repayments | (4 | ) | (6 | ) | ||
| Dividends | (175 | ) | (178 | ) | ||
| Disbursements to non-controlling interests (note 15) | (62 | ) | (267 | ) | ||
| Pueblo Viejo JV partner shareholder loan | 20 | 45 | ||||
| Net cash used in financing activities | (221 | ) | (406 | ) | ||
| Effect of exchange rate changes on cash and equivalents | — | — | ||||
| Net increase (decrease) in cash and equivalents | (63 | ) | 607 | |||
| Cash and equivalents at the beginning of period | 4,440 | 5,280 | ||||
| Cash and equivalents at the end of period | $4,377 | $5,887 | ||||
2022 figures have been restated to reflect the change in presentation to present interest received ($10 million) separately from finance costs.
Income taxes paid excludes $28 million (2022: $26 million) for the three months ended March 31, 2023 of income taxes payable that were settled against offsetting VAT receivables.
Consolidated Balance Sheets
| Barrick Gold Corporation | As at March 31, | As at December 31, | ||||
| (in millions of United States dollars) (Unaudited) | 2023 | 2022 | ||||
| ASSETS | ||||||
| Current assets | ||||||
| Cash and equivalents | $4,377 | $4,440 | ||||
| Accounts receivable | 557 | 554 | ||||
| Inventories | 1,913 | 1,781 | ||||
| Other current assets | 1,691 | 1690 | ||||
| Total current assets | $8,538 | $8,465 | ||||
| Non-current assets | ||||||
| Equity in investees (note 11) | 3,969 | 3,983 | ||||
| Property, plant and equipment | 26,084 | 25,821 | ||||
| Goodwill | 3,581 | 3,581 | ||||
| Intangible assets | 149 | 149 | ||||
| Deferred income tax assets | 19 | 19 | ||||
| Non-current portion of inventory | 2,705 | 2,819 | ||||
| Other assets | 1,107 | 1,128 | ||||
| Total assets | $46,152 | $45,965 | ||||
| LIABILITIES AND EQUITY | ||||||
| Current liabilities | ||||||
| Accounts payable | $1,504 | $1,556 | ||||
| Debt | 12 | 13 | ||||
| Current income tax liabilities | 310 | 163 | ||||
| Other current liabilities | 1,380 | 1,388 | ||||
| Total current liabilities | $3,206 | $3,120 | ||||
| Non-current liabilities | ||||||
| Debt | 4,765 | 4,769 | ||||
| Provisions | 2,244 | 2,211 | ||||
| Deferred income tax liabilities | 3,270 | 3,247 | ||||
| Other liabilities | 1,349 | 1,329 | ||||
| Total liabilities | $14,834 | $14,676 | ||||
| Equity | ||||||
| Capital stock (note 14) | $28,115 | $28,114 | ||||
| Deficit | (7,338 | ) | (7,282 | ) | ||
| Accumulated other comprehensive income (loss) | 23 | 26 | ||||
| Other | 1,913 | 1,913 | ||||
| Total equity attributable to Barrick Gold Corporation shareholders | $22,713 | $22,771 | ||||
| Non-controlling interests (note 15) | 8,605 | 8,518 | ||||
| Total equity | $31,318 | $31,289 | ||||
| Contingencies and commitments (notes 4 and 16) | ||||||
| Total liabilities and equity | $46,152 | $45,965 | ||||
Consolidated Statements of Changes in Equity
| Barrick Gold Corporation | Attributable to equity holders of the company | |||||||||||||||||
| (in millions of United States dollars) (Unaudited) | Common Shares (in thousands) | Capital stock | Retained earnings (deficit) | Accumulated other comprehensive income (loss)1 | Other2 | Total equity attributable to shareholders | Non-controlling interests | Total equity | ||||||||||
| At January 1, 2023 | 1,755,350 | $28,114 | ($7,282 | ) | $26 | $1,913 | $22,771 | $8,518 | $31,289 | |||||||||
| Net income | — | — | 120 | — | — | 120 | 149 | 269 | ||||||||||
| Total other comprehensive loss | — | — | — | (3 | ) | — | (3 | ) | — | (3 | ) | |||||||
| Total comprehensive income (loss) | — | — | 120 | (3 | ) | — | 117 | 149 | 266 | |||||||||
| Transactions with owners | ||||||||||||||||||
| Dividends | — | — | (175 | ) | — | — | (175 | ) | — | (175 | ) | |||||||
| Disbursements to non-controlling interests (note 15) | — | — | — | — | — | — | (62 | ) | (62 | ) | ||||||||
| Dividend reinvestment plan (note 14) | 58 | 1 | (1 | ) | — | — | — | — | — | |||||||||
| Total transactions with owners | 58 | 1 | (176 | ) | — | — | (175 | ) | (62 | ) | (237 | ) | ||||||
| At March 31, 2023 | 1,755,408 | $28,115 | ($7,338 | ) | $23 | $1,913 | $22,713 | $8,605 | $31,318 | |||||||||
| At January 1, 2022 | 1,779,331 | $28,497 | ($6,566 | ) | ($23 | ) | $1,949 | $23,857 | $8,450 | $32,307 | ||||||||
| Net income | — | — | 438 | — | — | 438 | 268 | 706 | ||||||||||
| Total other comprehensive income | — | — | — | 58 | — | 58 | — | 58 | ||||||||||
| Total comprehensive income | — | — | 438 | 58 | — | 496 | 268 | 764 | ||||||||||
| Transactions with owners | ||||||||||||||||||
| Dividends | — | — | (178 | ) | — | — | (178 | ) | — | (178 | ) | |||||||
| Disbursements to non-controlling interests | — | — | — | — | — | — | (267 | ) | (267 | ) | ||||||||
| Dividend reinvestment plan | 25 | — | — | — | — | — | — | — | ||||||||||
| Total transactions with owners | 25 | — | (178 | ) | — | — | (178 | ) | (267 | ) | (445 | ) | ||||||
| At March 31, 2022 | 1,779,356 | $28,497 | ($6,306 | ) | $35 | $1,949 | $24,175 | $8,451 | $32,626 | |||||||||
2023 Operating and Capital Expenditure Guidance
| GOLD PRODUCTION AND COSTS | ||||
| 2023 forecast attributable production (000s oz) | 2023 forecast cost of sales9 ($/oz) | 2023 forecast total cash costs10 ($/oz) | 2023 forecast all-in sustaining costs10 ($/oz) | |
| Carlin (61.5%) | 910 – 1,000 | 1,030 – 1,110 | 820 – 880 | 1,250 – 1,330 |
| Cortez (61.5%)18 | 580 – 650 | 1,080 – 1,160 | 680 – 740 | 930 – 1,010 |
| Turquoise Ridge (61.5%) | 300 – 340 | 1,290 – 1,370 | 900 – 960 | 1,170 – 1,250 |
| Phoenix (61.5%) | 100 – 120 | 1,860 – 1,940 | 880 – 940 | 1,110 – 1,190 |
| Long Canyon (61.5%) | 0 – 10 | 2,120 – 2,200 | 730 – 790 | 1,080 – 1,160 |
| Nevada Gold Mines (61.5%) | 1,900 – 2,100 | 1,140 – 1,220 | 790 – 850 | 1,140 – 1,220 |
| Hemlo | 150 – 170 | 1,400 – 1,480 | 1,210 – 1,270 | 1,590 – 1,670 |
| North America | 2,100 – 2,300 | 1,160 – 1,240 | 820 – 880 | 1,170 – 1,250 |
| Pueblo Viejo (60%) | 470 – 520 | 1,130 – 1,210 | 710 – 770 | 960 – 1,040 |
| Veladero (50%) | 160 – 180 | 1,630 – 1,710 | 1,060 – 1,120 | 1,550 – 1,630 |
| Porgera (47.5%)13 | — | — | — | — |
| Latin America & Asia Pacific | 630 – 700 | 1,260 – 1,340 | 800 – 860 | 1,110 – 1,190 |
| Loulo-Gounkoto (80%) | 510 – 560 | 1,100 – 1,180 | 750 – 810 | 1,070 – 1,150 |
| Kibali (45%) | 320 – 360 | 1,080 – 1,160 | 710 – 770 | 880 – 960 |
| North Mara (84%) | 230 – 260 | 1,120 – 1,200 | 900 – 960 | 1,240 – 1,320 |
| Bulyanhulu (84%) | 160 – 190 | 1,230 – 1,310 | 880 – 940 | 1,160 – 1,240 |
| Tongon (89.7%) | 180 – 210 | 1,260 – 1,340 | 1,070 – 1,130 | 1,240 – 1,320 |
| Africa & Middle East | 1,450 – 1,600 | 1,130 – 1,210 | 820 – 880 | 1,080 – 1,160 |
| Total Attributable to Barrick19,20,21 | 4,200 – 4,600 | 1,170 – 1,250 | 820 – 880 | 1,170 – 1,250 |
| COPPER PRODUCTION AND COSTS | ||||
| 2023 forecast attributable production (Mlbs) | 2023 forecast cost of sales9($/lb) | 2023 forecast C1 cash costs11($/lb) | 2023 forecast all-in sustaining costs11($/lb) | |
| Lumwana | 260 – 290 | 2.45 – 2.75 | 2.00 – 2.20 | 3.20 – 3.50 |
| Zaldívar (50%) | 100 – 110 | 3.40 – 3.70 | 2.60 – 2.80 | 2.90 – 3.20 |
| Jabal Sayid (50%) | 65 – 75 | 1.80 – 2.10 | 1.50 – 1.70 | 1.60 – 1.90 |
| Total Attributable to Barrick21 | 420 – 470 | 2.60 – 2.90 | 2.05 – 2.25 | 2.95 – 3.25 |
| ATTRIBUTABLE CAPITAL EXPENDITURES | ||||
| ($ millions) | ||||
| Attributable minesite sustaining7 | 1,450 – 1,700 | |||
| Attributable project7 | 750 – 900 | |||
| Total attributable capital expenditures | 2,200 – 2,600 | |||
2023 Outlook Assumptions and Economic Sensitivity Analysis
| 2023 Guidance Assumption | Hypothetical Change | Impact on EBITDA22 (millions) | Impact on TCC and AISC10,11 | |
| Gold price sensitivity | $1,650/oz | +/- $100/oz | +/- $590 | +/- $5/oz |
| Copper price sensitivity | $3.50/lb | +/- $0.25/lb | +/- $110 | +/- $0.01/lb |
Production and Cost Summary – Gold
| For the three months ended | ||||||||||||||
| 3/31/23 | 12/31/22 | % Change | 3/31/22 | % Change | ||||||||||
| Nevada Gold Mines LLC (61.5%)a | ||||||||||||||
| Gold produced (000s oz attributable basis) | 416 | 516 | (19 | )% | 459 | (9 | )% | |||||||
| Gold produced (000s oz 100% basis) | 676 | 838 | (19 | )% | 747 | (9 | )% | |||||||
| Cost of sales ($/oz) | 1,461 | 1,257 | 16 | % | 1,169 | 25 | % | |||||||
| Total cash costs ($/oz)b | 1,074 | 906 | 19 | % | 820 | 31 | % | |||||||
| All-in sustaining costs ($/oz)b | 1,436 | 1,179 | 22 | % | 1,118 | 28 | % | |||||||
| Carlin (61.5%)c | ||||||||||||||
| Gold produced (000s oz attributable basis) | 166 | 265 | (37 | )% | 229 | (28 | )% | |||||||
| Gold produced (000s oz 100% basis) | 270 | 432 | (37 | )% | 373 | (28 | )% | |||||||
| Cost of sales ($/oz) | 1,449 | 1,081 | 34 | % | 1,015 | 43 | % | |||||||
| Total cash costs ($/oz)b | 1,215 | 878 | 38 | % | 829 | 47 | % | |||||||
| All-in sustaining costs ($/oz)b | 1,689 | 1,217 | 39 | % | 1,139 | 48 | % | |||||||
| Cortez (61.5%)c | ||||||||||||||
| Gold produced (000s oz attributable basis) | 140 | 140 | 0 | % | 115 | 22 | % | |||||||
| Gold produced (000s oz 100% basis) | 226 | 226 | 0 | % | 187 | 22 | % | |||||||
| Cost of sales ($/oz) | 1,324 | 1,284 | 3 | % | 1,113 | 19 | % | |||||||
| Total cash costs ($/oz)b | 913 | 848 | 8 | % | 784 | 16 | % | |||||||
| All-in sustaining costs ($/oz)b | 1,233 | 1,037 | 19 | % | 1,150 | 7 | % | |||||||
| Turquoise Ridge (61.5%) | ||||||||||||||
| Gold produced (000s oz attributable basis) | 81 | 78 | 4 | % | 67 | 21 | % | |||||||
| Gold produced (000s oz 100% basis) | 131 | 127 | 4 | % | 109 | 21 | % | |||||||
| Cost of sales ($/oz) | 1,412 | 1,518 | (7 | )% | 1,436 | (2 | )% | |||||||
| Total cash costs ($/oz)b | 1,034 | 1,089 | (5 | )% | 1,030 | 0 | % | |||||||
| All-in sustaining costs ($/oz)b | 1,271 | 1,304 | (3 | )% | 1,281 | (1 | )% | |||||||
| Phoenix (61.5%) | ||||||||||||||
| Gold produced (000s oz attributable basis) | 27 | 30 | (10 | )% | 23 | 17 | % | |||||||
| Gold produced (000s oz 100% basis) | 45 | 48 | (10 | )% | 37 | 17 | % | |||||||
| Cost of sales ($/oz) | 2,380 | 1,901 | 25 | % | 2,253 | 6 | % | |||||||
| Total cash costs ($/oz)b | 1,198 | 946 | 27 | % | 835 | 43 | % | |||||||
| All-in sustaining costs ($/oz)b | 1,365 | 1,037 | 32 | % | 1,027 | 33 | % | |||||||
| Long Canyon (61.5%) | ||||||||||||||
| Gold produced (000s oz attributable basis) | 2 | 3 | (33 | )% | 25 | (92 | )% | |||||||
| Gold produced (000s oz 100% basis) | 4 | 5 | (33 | )% | 41 | (92 | )% | |||||||
| Cost of sales ($/oz) | 1,621 | 1,812 | (11 | )% | 1,093 | 48 | % | |||||||
| Total cash costs ($/oz)b | 579 | 616 | (6 | )% | 342 | 69 | % | |||||||
| All-in sustaining costs ($/oz)b | 629 | 664 | (5 | )% | 366 | 72 | % | |||||||
| Pueblo Viejo (60%) | ||||||||||||||
| Gold produced (000s oz attributable basis) | 89 | 98 | (9 | )% | 104 | (14 | )% | |||||||
| Gold produced (000s oz 100% basis) | 149 | 163 | (9 | )% | 174 | (14 | )% | |||||||
| Cost of sales ($/oz) | 1,241 | 1,215 | 2 | % | 1,077 | 15 | % | |||||||
| Total cash costs ($/oz)b | 714 | 764 | (7 | )% | 682 | 5 | % | |||||||
| All-in sustaining costs ($/oz)b | 1,073 | 1,065 | 1 | % | 948 | 13 | % | |||||||
| Loulo-Gounkoto (80%) | ||||||||||||||
| Gold produced (000s oz attributable basis) | 137 | 139 | (1 | )% | 138 | (1 | )% | |||||||
| Gold produced (000s oz 100% basis) | 172 | 174 | (1 | )% | 172 | (1 | )% | |||||||
| Cost of sales ($/oz) | 1,275 | 1,216 | 5 | % | 1,088 | 17 | % | |||||||
| Total cash costs ($/oz)b | 855 | 822 | 4 | % | 721 | 19 | % | |||||||
| All-in sustaining costs ($/oz)b | 1,190 | 1,102 | 8 | % | 982 | 21 | % | |||||||
| Kibali (45%) | ||||||||||||||
| Gold produced (000s oz attributable basis) | 64 | 97 | (34 | )% | 76 | (16 | )% | |||||||
| Gold produced (000s oz 100% basis) | 141 | 216 | (34 | )% | 168 | (16 | )% | |||||||
| Cost of sales ($/oz) | 1,367 | 1,570 | (13 | )% | 1,137 | 20 | % | |||||||
| Total cash costs ($/oz)b | 987 | 617 | 60 | % | 744 | 33 | % | |||||||
| All-in sustaining costs ($/oz)b | 1,177 | 981 | 20 | % | 996 | 18 | % | |||||||
| Veladero (50%) | ||||||||||||||
| Gold produced (000s oz attributable basis) | 43 | 50 | (14 | )% | 46 | (7 | )% | |||||||
| Gold produced (000s oz 100% basis) | 86 | 99 | (14 | )% | 92 | (7 | )% | |||||||
| Cost of sales ($/oz) | 1,587 | 2,309 | (31 | )% | 1,348 | 18 | % | |||||||
| Total cash costs ($/oz)b | 1,035 | 954 | 8 | % | 847 | 22 | % | |||||||
| All-in sustaining costs ($/oz)b | 1,761 | 1,526 | 15 | % | 1,588 | 11 | % | |||||||
| Porgera (47.5%)d | ||||||||||||||
| Gold produced (000s oz attributable basis) | — | — | — | % | — | — | % | |||||||
| Gold produced (000s oz 100% basis) | — | — | — | % | — | — | % | |||||||
| Cost of sales ($/oz) | — | — | — | % | — | — | % | |||||||
| Total cash costs ($/oz)b | — | — | — | % | — | — | % | |||||||
| All-in sustaining costs ($/oz)b | — | — | — | % | — | — | % | |||||||
| Tongon (89.7%) | ||||||||||||||
| Gold produced (000s oz attributable basis) | 50 | 63 | (21 | )% | 35 | 43 | % | |||||||
| Gold produced (000s oz 100% basis) | 55 | 70 | (21 | )% | 39 | 43 | % | |||||||
| Cost of sales ($/oz) | 1,453 | 1,381 | 5 | % | 2,036 | (29 | )% | |||||||
| Total cash costs ($/oz)b | 1,182 | 1,070 | 10 | % | 1,667 | (29 | )% | |||||||
| All-in sustaining costs ($/oz)b | 1,284 | 1,404 | (9 | )% | 1,803 | (29 | )% | |||||||
| Hemlo | ||||||||||||||
| Gold produced (000s oz) | 41 | 38 | 8 | % | 31 | 32 | % | |||||||
| Cost of sales ($/oz) | 1,486 | 1,451 | 2 | % | 1,727 | (14 | )% | |||||||
| Total cash costs ($/oz)b | 1,291 | 1,227 | 5 | % | 1,503 | (14 | )% | |||||||
| All-in sustaining costs ($/oz)b | 1,609 | 1,557 | 3 | % | 1,982 | (19 | )% | |||||||
| North Mara (84%) | ||||||||||||||
| Gold produced (000s oz attributable basis) | 68 | 70 | (3 | )% | 56 | 21 | % | |||||||
| Gold produced (000s oz 100% basis) | 81 | 84 | (3 | )% | 66 | 21 | % | |||||||
| Cost of sales ($/oz) | 987 | 1,030 | (4 | )% | 852 | 16 | % | |||||||
| Total cash costs ($/oz)b | 759 | 758 | 0 | % | 709 | 7 | % | |||||||
| All-in sustaining costs ($/oz)b | 1,137 | 1,301 | (13 | )% | 874 | 30 | % | |||||||
| Bulyanhulu (84%) | ||||||||||||||
| Gold produced (000s oz attributable basis) | 44 | 49 | (10 | )% | 45 | (2 | )% | |||||||
| Gold produced (000s oz 100% basis) | 53 | 58 | (10 | )% | 53 | (2 | )% | |||||||
| Cost of sales ($/oz) | 1,358 | 1,237 | 10 | % | 1,216 | 12 | % | |||||||
| Total cash costs ($/oz)b | 982 | 896 | 10 | % | 847 | 16 | % | |||||||
| All-in sustaining costs ($/oz)b | 1,332 | 1,401 | (5 | )% | 984 | 35 | % | |||||||
| Total Attributable to Barricke | ||||||||||||||
| Gold produced (000s oz) | 952 | 1,120 | (15 | )% | 990 | (4 | )% | |||||||
| Cost of sales ($/oz)f | 1,378 | 1,324 | 4 | % | 1,190 | 16 | % | |||||||
| Total cash costs ($/oz)b | 986 | 868 | 14 | % | 832 | 19 | % | |||||||
| All-in sustaining costs ($/oz)b | 1,370 | 1,242 | 10 | % | 1,164 | 18 | % | |||||||
Production and Cost Summary – Copper
| For the three months ended | |||||||
| 3/31/23 | 12/31/22 | % Change | 3/31/22 | % Change | |||
| Lumwana | |||||||
| Copper production (Mlbs) | 48 | 53 | (9 | )% | 57 | (16 | )% |
| Cost of sales ($/lb) | 3.56 | 3.56 | 0 | % | 2.20 | 62 | % |
| C1 cash costs ($/lb)a | 3.09 | 2.34 | 32 | % | 1.86 | 66 | % |
| All-in sustaining costs ($/lb)a | 3.98 | 4.86 | (18 | )% | 3.16 | 26 | % |
| Zaldívar (50%) | |||||||
| Copper production (Mlbs attributable basis) | 22 | 25 | (12 | )% | 25 | (12 | )% |
| Copper production (Mlbs 100% basis) | 44 | 50 | (12 | )% | 51 | (12 | )% |
| Cost of sales ($/lb) | 3.73 | 3.55 | 5 | % | 2.85 | 31 | % |
| C1 cash costs ($/lb)a | 2.86 | 2.69 | 6 | % | 2.15 | 33 | % |
| All-in sustaining costs ($/lb)a | 3.22 | 3.60 | (11 | )% | 2.64 | 22 | % |
| Jabal Sayid (50%) | |||||||
| Copper production (Mlbs attributable basis) | 18 | 18 | 0 | % | 19 | (5 | )% |
| Copper production (Mlbs 100% basis) | 37 | 36 | 0 | % | 38 | (5 | )% |
| Cost of sales ($/lb) | 1.53 | 1.72 | (11 | )% | 1.30 | 18 | % |
| C1 cash costs ($/lb)a | 1.39 | 1.42 | (2 | )% | 1.10 | 26 | % |
| All-in sustaining costs ($/lb)a | 1.61 | 1.54 | 5 | % | 1.17 | 38 | % |
| Total Attributable to Barrick | |||||||
| Copper production (Mlbs) | 88 | 96 | (8 | )% | 101 | (13 | )% |
| Cost of sales ($/lb)b | 3.22 | 3.19 | 1 | % | 2.21 | 46 | % |
| C1 cash costs ($/lb)a | 2.71 | 2.25 | 20 | % | 1.81 | 50 | % |
| All-in sustaining costs ($/lb)a | 3.40 | 3.98 | (15 | )% | 2.85 | 19 | % |
Copper cost of sales per pound is calculated as cost of sales across our copper operations divided by pounds sold (both on an attributable basis using Barrick’s ownership share).
Financial and Operating Highlights
| For the three months ended | |||||||||||
| 3/31/23 | 12/31/22 | % Change | 3/31/22 | % Change | |||||||
| Financial Results ($ millions) | |||||||||||
| Revenues | 2,643 | 2,774 | (5 | )% | 2,853 | (7 | )% | ||||
| Cost of sales | 1,941 | 2,093 | (7 | )% | 1,739 | 12 | % | ||||
| Net earningsa | 120 | (735 | ) | 116 | % | 438 | (73 | )% | |||
| Adjusted net earningsb | 247 | 220 | 12 | % | 463 | (47 | )% | ||||
| Adjusted EBITDAb | 1,183 | 1,286 | (8 | )% | 1,645 | (28 | )% | ||||
| Adjusted EBITDA marginc | 45 | % | 46 | % | (2 | )% | 58 | % | (22 | )% | |
| Minesite sustaining capital expendituresb,d | 454 | 557 | (18 | )% | 420 | 8 | % | ||||
| Project capital expendituresb,d | 226 | 324 | (30 | )% | 186 | 22 | % | ||||
| Total consolidated capital expendituresd,e | 688 | 891 | (23 | )% | 611 | 13 | % | ||||
| Net cash provided by operating activities | 776 | 795 | (2 | )% | 1,004 | (23 | )% | ||||
| Net cash provided by operating activities marginf | 29 | % | 29 | % | 0 | % | 35 | % | (17 | )% | |
| Free cash flowb | 88 | (96 | ) | 192 | % | 393 | (78 | )% | |||
| Net earnings per share (basic and diluted) | 0.07 | (0.42 | ) | 117 | % | 0.25 | (72 | )% | |||
| Adjusted net earnings (basic)b per share | 0.14 | 0.13 | 8 | % | 0.26 | (46 | )% | ||||
| Weighted average diluted common shares (millions of shares) | 1,755 | 1,759 | 0 | % | 1,779 | (1 | )% | ||||
| Operating Results | |||||||||||
| Gold production (thousands of ounces)g | 952 | 1,120 | (15 | )% | 990 | (4 | )% | ||||
| Gold sold (thousands of ounces)g | 954 | 1,111 | (14 | )% | 993 | (4 | )% | ||||
| Market gold price ($/oz) | 1,890 | 1,726 | 10 | % | 1,877 | 1 | % | ||||
| Realized gold priceb,g ($/oz) | 1,902 | 1,728 | 10 | % | 1,876 | 1 | % | ||||
| Gold cost of sales (Barrick’s share)g,h ($/oz) | 1,378 | 1,324 | 4 | % | 1,190 | 16 | % | ||||
| Gold total cash costsb,g ($/oz) | 986 | 868 | 14 | % | 832 | 19 | % | ||||
| Gold all-in sustaining costsb,g ($/oz) | 1,370 | 1,242 | 10 | % | 1,164 | 18 | % | ||||
| Copper production (millions of pounds)g | 88 | 96 | (8 | )% | 101 | (13 | )% | ||||
| Copper sold (millions of pounds)g | 89 | 99 | (10 | )% | 113 | (21 | )% | ||||
| Market copper price ($/lb) | 4.05 | 3.63 | 12 | % | 4.53 | (11 | )% | ||||
| Realized copper priceb,g ($/lb) | 4.20 | 3.81 | 10 | % | 4.68 | (10 | )% | ||||
| Copper cost of sales (Barrick’s share)g,i ($/lb) | 3.22 | 3.19 | 1 | % | 2.21 | 46 | % | ||||
| Copper C1 cash costsb,g ($/lb) | 2.71 | 2.25 | 20 | % | 1.81 | 50 | % | ||||
| Copper all-in sustaining costsb,g ($/lb) | 3.40 | 3.98 | (15 | )% | 2.85 | 19 | % | ||||
| As at 3/31/23 | As at 12/31/22 | % Change | As at 3/31/22 | % Change | |||||||
| Financial Position ($ millions) | |||||||||||
| Debt (current and long-term) | 4,777 | 4,782 | 0 | % | 5,144 | (7 | )% | ||||
| Cash and equivalents | 4,377 | 4,440 | (1 | )% | 5,887 | (26 | )% | ||||
| Debt, net of cash | 400 | 342 | 17 | % | (743 | ) | 154 | % | |||
Net earnings represents net earnings attributable to the equity holders of the Company.
Further information on these non-GAAP financial performance measures, including detailed reconciliations, is included in the endnotes to this press release.
Represents adjusted EBITDA divided by revenue.
Amounts presented on a consolidated cash basis. Project capital expenditures are included in our calculation of all-in costs, but not included in our calculation of all-in sustaining costs.
Total consolidated capital expenditures also includes capitalized interest of $8 million for the three month period ended March 31, 2023 (December 31, 2022: $10 million and March 31, 2022: $5 million).
Represents net cash provided by operating activities divided by revenue.
On an attributable basis.
Gold cost of sales per ounce is calculated as cost of sales across our gold operations (excluding sites in closure or care and maintenance) divided by ounces sold (both on an attributable basis using Barrick’s ownership share).
Copper cost of sales per pound is calculated as cost of sales across our copper operations divided by pounds sold (both on an attributable basis using Barrick’s ownership share).
Consolidated Statements of Income
| Barrick Gold Corporation (in millions of United States dollars, except per share data) (Unaudited) | Three months ended March 31, | |||||
| 2023 | 2022 | |||||
| Revenue (notes 4 and 5) | $2,643 | $2,853 | ||||
| Costs and expenses (income) | ||||||
| Cost of sales (notes 4 and 6) | 1,941 | 1,739 | ||||
| General and administrative expenses | 39 | 54 | ||||
| Exploration, evaluation and project expenses | 71 | 67 | ||||
| Impairment charges (notes 8b and 12) | 1 | 2 | ||||
| Loss on currency translation | 38 | 3 | ||||
| Closed mine rehabilitation | 22 | 3 | ||||
| Income from equity investees (note 11) | (53 | ) | (99 | ) | ||
| Other expense (income) (note 8a) | 52 | (11 | ) | |||
| Income before finance costs and income taxes | $532 | $1,095 | ||||
| Finance costs, net | (58 | ) | (88 | ) | ||
| Income before income taxes | $474 | $1,007 | ||||
| Income tax expense (note 9) | (205 | ) | (301 | ) | ||
| Net income | $269 | $706 | ||||
| Attributable to: | ||||||
| Equity holders of Barrick Gold Corporation | $120 | $438 | ||||
| Non-controlling interests (note 15) | $149 | $268 | ||||
| Earnings per share data attributable to the equity holders of Barrick Gold Corporation (note 7) | ||||||
| Net income | ||||||
| Basic | $0.07 | $0.25 | ||||
| Diluted | $0.07 | $0.25 | ||||
Consolidated Statements of Comprehensive Income
| Barrick Gold Corporation (in millions of United States dollars) (Unaudited) | Three months ended March 31, | |||||
| 2023 | 2022 | |||||
| Net income | $269 | $706 | ||||
| Other comprehensive income (loss), net of taxes | ||||||
| Items that may be reclassified subsequently to profit or loss: | ||||||
| Currency translation adjustments, net of tax $nil and $nil | (3 | ) | — | |||
| Items that will not be reclassified to profit or loss: | ||||||
| Net change on equity investments, net of tax $nil and ($8) | — | 58 | ||||
| Total other comprehensive (loss) income | (3 | ) | 58 | |||
| Total comprehensive income | $266 | $764 | ||||
| Attributable to: | ||||||
| Equity holders of Barrick Gold Corporation | $117 | $496 | ||||
| Non-controlling interests | $149 | $268 | ||||
Consolidated Statements of Cash Flow
| Barrick Gold Corporation (in millions of United States dollars) (Unaudited) | Three months ended March 31, | |||||
| 2023 | 2022 | |||||
| OPERATING ACTIVITIES | ||||||
| Net income | $269 | $706 | ||||
| Adjustments for the following items: | ||||||
| Depreciation | 495 | 460 | ||||
| Finance costs, net1 | 58 | 88 | ||||
| Impairment charges (notes 8b and 12) | 1 | 2 | ||||
| Income tax expense (note 9) | 205 | 301 | ||||
| Income from equity investees (note 11) | (53 | ) | (99 | ) | ||
| Gain on sale of non-current assets | (3 | ) | (2 | ) | ||
| Loss on currency translation | 38 | 3 | ||||
| Change in working capital (note 10) | (206 | ) | (131 | ) | ||
| Other operating activities (note 10) | 52 | (77 | ) | |||
| Operating cash flows before interest and income taxes | 856 | 1,251 | ||||
| Interest paid | (23 | ) | (23 | ) | ||
| Interest received1 | 49 | 10 | ||||
| Income taxes paid2 | (106 | ) | (234 | ) | ||
| Net cash provided by operating activities | 776 | 1,004 | ||||
| INVESTING ACTIVITIES | ||||||
| Property, plant and equipment | ||||||
| Capital expenditures (note 4) | (688 | ) | (611 | ) | ||
| Sales proceeds | 3 | 1 | ||||
| Investment sales | — | 260 | ||||
| Dividends received from equity method investments (note 11) | 67 | 359 | ||||
| Net cash provided by (used in) investing activities | (618 | ) | 9 | |||
| FINANCING ACTIVITIES | ||||||
| Lease repayments | (4 | ) | (6 | ) | ||
| Dividends | (175 | ) | (178 | ) | ||
| Disbursements to non-controlling interests (note 15) | (62 | ) | (267 | ) | ||
| Pueblo Viejo JV partner shareholder loan | 20 | 45 | ||||
| Net cash used in financing activities | (221 | ) | (406 | ) | ||
| Effect of exchange rate changes on cash and equivalents | — | — | ||||
| Net increase (decrease) in cash and equivalents | (63 | ) | 607 | |||
| Cash and equivalents at the beginning of period | 4,440 | 5,280 | ||||
| Cash and equivalents at the end of period | $4,377 | $5,887 | ||||
2022 figures have been restated to reflect the change in presentation to present interest received ($10 million) separately from finance costs.
Income taxes paid excludes $28 million (2022: $26 million) for the three months ended March 31, 2023 of income taxes payable that were settled against offsetting VAT receivables.
Consolidated Balance Sheets
| Barrick Gold Corporation | As at March 31, | As at December 31, | ||||
| (in millions of United States dollars) (Unaudited) | 2023 | 2022 | ||||
| ASSETS | ||||||
| Current assets | ||||||
| Cash and equivalents | $4,377 | $4,440 | ||||
| Accounts receivable | 557 | 554 | ||||
| Inventories | 1,913 | 1,781 | ||||
| Other current assets | 1,691 | 1690 | ||||
| Total current assets | $8,538 | $8,465 | ||||
| Non-current assets | ||||||
| Equity in investees (note 11) | 3,969 | 3,983 | ||||
| Property, plant and equipment | 26,084 | 25,821 | ||||
| Goodwill | 3,581 | 3,581 | ||||
| Intangible assets | 149 | 149 | ||||
| Deferred income tax assets | 19 | 19 | ||||
| Non-current portion of inventory | 2,705 | 2,819 | ||||
| Other assets | 1,107 | 1,128 | ||||
| Total assets | $46,152 | $45,965 | ||||
| LIABILITIES AND EQUITY | ||||||
| Current liabilities | ||||||
| Accounts payable | $1,504 | $1,556 | ||||
| Debt | 12 | 13 | ||||
| Current income tax liabilities | 310 | 163 | ||||
| Other current liabilities | 1,380 | 1,388 | ||||
| Total current liabilities | $3,206 | $3,120 | ||||
| Non-current liabilities | ||||||
| Debt | 4,765 | 4,769 | ||||
| Provisions | 2,244 | 2,211 | ||||
| Deferred income tax liabilities | 3,270 | 3,247 | ||||
| Other liabilities | 1,349 | 1,329 | ||||
| Total liabilities | $14,834 | $14,676 | ||||
| Equity | ||||||
| Capital stock (note 14) | $28,115 | $28,114 | ||||
| Deficit | (7,338 | ) | (7,282 | ) | ||
| Accumulated other comprehensive income (loss) | 23 | 26 | ||||
| Other | 1,913 | 1,913 | ||||
| Total equity attributable to Barrick Gold Corporation shareholders | $22,713 | $22,771 | ||||
| Non-controlling interests (note 15) | 8,605 | 8,518 | ||||
| Total equity | $31,318 | $31,289 | ||||
| Contingencies and commitments (notes 4 and 16) | ||||||
| Total liabilities and equity | $46,152 | $45,965 | ||||
Consolidated Statements of Changes in Equity
| Barrick Gold Corporation | Attributable to equity holders of the company | |||||||||||||||||
| (in millions of United States dollars) (Unaudited) | Common Shares (in thousands) | Capital stock | Retained earnings (deficit) | Accumulated other comprehensive income (loss)1 | Other2 | Total equity attributable to shareholders | Non-controlling interests | Total equity | ||||||||||
| At January 1, 2023 | 1,755,350 | $28,114 | ($7,282 | ) | $26 | $1,913 | $22,771 | $8,518 | $31,289 | |||||||||
| Net income | — | — | 120 | — | — | 120 | 149 | 269 | ||||||||||
| Total other comprehensive loss | — | — | — | (3 | ) | — | (3 | ) | — | (3 | ) | |||||||
| Total comprehensive income (loss) | — | — | 120 | (3 | ) | — | 117 | 149 | 266 | |||||||||
| Transactions with owners | ||||||||||||||||||
| Dividends | — | — | (175 | ) | — | — | (175 | ) | — | (175 | ) | |||||||
| Disbursements to non-controlling interests (note 15) | — | — | — | — | — | — | (62 | ) | (62 | ) | ||||||||
| Dividend reinvestment plan (note 14) | 58 | 1 | (1 | ) | — | — | — | — | — | |||||||||
| Total transactions with owners | 58 | 1 | (176 | ) | — | — | (175 | ) | (62 | ) | (237 | ) | ||||||
| At March 31, 2023 | 1,755,408 | $28,115 | ($7,338 | ) | $23 | $1,913 | $22,713 | $8,605 | $31,318 | |||||||||
| At January 1, 2022 | 1,779,331 | $28,497 | ($6,566 | ) | ($23 | ) | $1,949 | $23,857 | $8,450 | $32,307 | ||||||||
| Net income | — | — | 438 | — | — | 438 | 268 | 706 | ||||||||||
| Total other comprehensive income | — | — | — | 58 | — | 58 | — | 58 | ||||||||||
| Total comprehensive income | — | — | 438 | 58 | — | 496 | 268 | 764 | ||||||||||
| Transactions with owners | ||||||||||||||||||
| Dividends | — | — | (178 | ) | — | — | (178 | ) | — | (178 | ) | |||||||
| Disbursements to non-controlling interests | — | — | — | — | — | — | (267 | ) | (267 | ) | ||||||||
| Dividend reinvestment plan | 25 | — | — | — | — | — | — | — | ||||||||||
| Total transactions with owners | 25 | — | (178 | ) | — | — | (178 | ) | (267 | ) | (445 | ) | ||||||
| At March 31, 2022 | 1,779,356 | $28,497 | ($6,306 | ) | $35 | $1,949 | $24,175 | $8,451 | $32,626 | |||||||||
Includes cumulative translation losses at March 31, 2023: $95 million (December 31, 2022: $93 million; March 31, 2022: $94 million).
Includes additional paid-in capital as at March 31, 2023: $1,875 million (December 31, 2022: $1,875 million; March 31, 2022: $1,911 million).
![]()