Glencore posts a $2.6 billion loss and scraps dividend
Miner and commodities trader giant Glencore (LON: GLEN) posted a $2.6 billion loss for the first half of the year and scrapped its dividend, as the coronavirus pandemic dented global demand and lowered prices and production at its mining division.
Despite the virus impact, the Swiss firm managed to remain profitable on an operating basis. Glencore posted $1.5 billion in adjusted earnings before interest and taxes, but booked $3.2 million in impairment charges.
The company said it was putting balance sheet strength ahead of shareholder returns, as net debt climbed 12% to $19.7 billion at the end of June.
GLENCORE IS PUTTING BALANCE SHEET STRENGTH AHEAD OF SHAREHOLDER RETURNS, AS NET DEBT CLIMBED 12% TO $19.7 BILLION AT THE END OF JUNE
The increase in borrowings came as Glencore tapped its credit lines to take advantage of falling oil prices in March and April — it bought cheap crude and sold it on the futures market for a profit. As a result, its marketing business performed especially well, with full-year earnings expected to come in at the top end of its $2.2-$3.2 billion range, after hitting $2 billion in the first half.
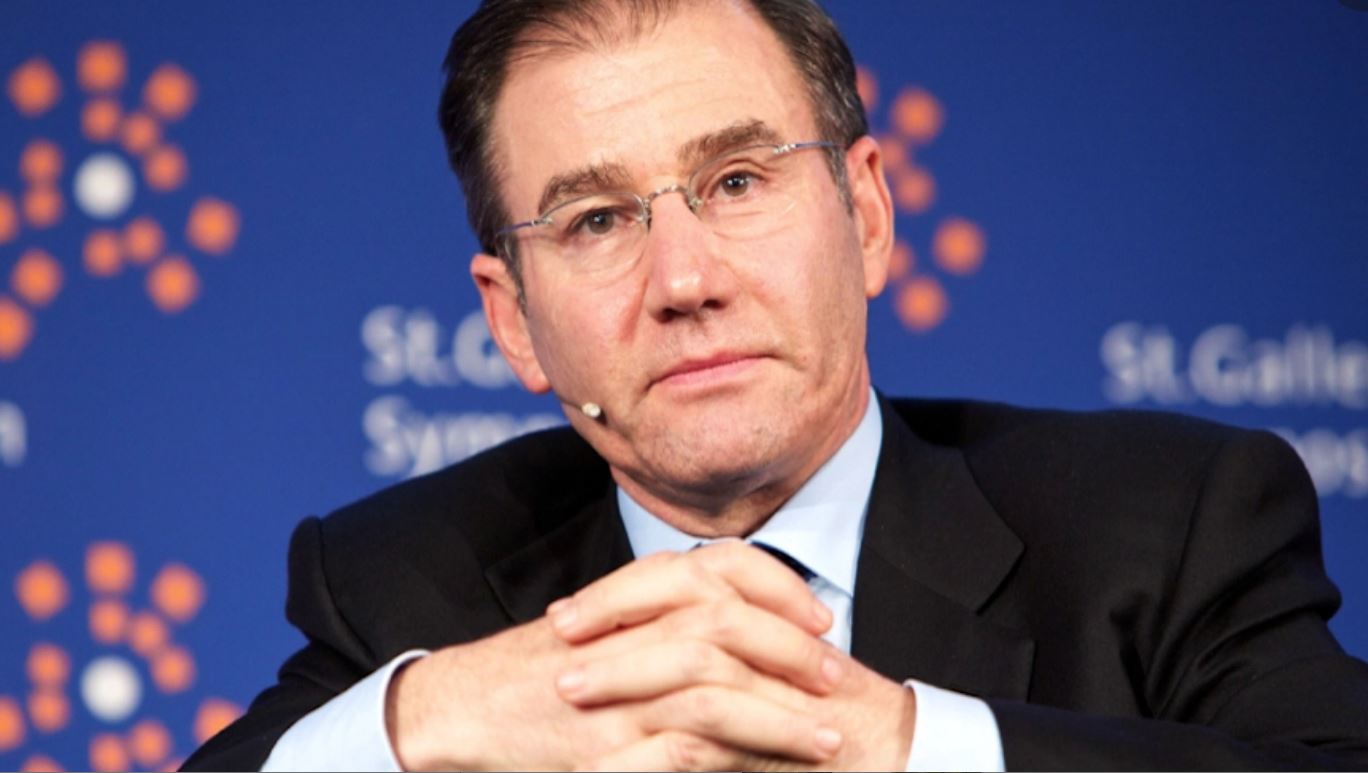
Chief executive Ivan Glasenberg said the board had concluded it would be “inappropriate to make a distribution to shareholders in 2020.” Instead, the firm will focus on debt reduction after pouring money into the oil trading business to cash in on volatile price swings.
Christopher LaFemina, analyst at Jefferies, said the decision to cancel the dividend was disappointing in light of the strong performance from the company’s trading arm.
“We believe Glencore has missed an opportunity to send a strong message to the market about its dividend policy being robust through the cycle,” he said.
BMO’s Edward Sterck said the bank expected the trading division’s oil position profit to be booked largely in the second half of the year. “It has clearly unwound some of the positions in H1 whilst still (looking at net debt combined with disclosures) retaining significant exposure,” he wrote in a note to investors.
The mining and metals expert added the move could lead to a beat in expectations for the second half of the year, but noted the market was “not given enough disclosure” to forecast with confidence.
No change in succession plans
Glasenberg, who has led Glencore since 2002, added that covid-19 had not changed the timing of succession plans, but declined to give further details.
The executive, who is the company’s second-biggest shareholder with a 9% stake, according to Refinitiv Eikon data, said in 2018 that he would step down in three to five years. At the time, he added the firm had begun training a small group of front runners to take over the post.
“As we said before covid… once the old guard is changed then I will move on,” Glasenberg said on Thursday, adding that the head of coal trading, Tor Peterson, was still due to leave. Long-time Glencore executive Daniel Mate, who led its zinc business, left last month.
Glencore has been transitioning to a new generation of management over the past couple of years, appointing new division heads to cover marketing and assets for coal, ferroalloys, copper and oil.
Uncertain outlook
The Swiss giant mined 588,100 tonnes of copper in the first half of the year, 11% less than during the same period of 2019.
The company said global mine supply would likely keep hurting because of covid-19 and new projects will experience delays. Aging equipment and declining ore grades are also likely to crimp global supply, Glencore said.
A rebound in demand, led by Chinese factories, would likely continue, “supported by significant economic stimulus measures being undertaken globally,” it said.
Glencore noted that the two key areas of cobalt demand, lithium-ion batteries for mobile phones and electric vehicles (EVs), looked “promising.”
“The growing momentum evident across the [EV] sector, together with a recovery in mobile-phone demand, points to higher future cobalt demand,” Glencore said.
On zinc, the company said it was still too early to tell what the metal’s supply balance would look like this year, with the scale of the pandemic’s effect on supply and demand still unknown.
NEWS RELEASE | Highlights
Glencore’s Chief Executive Officer, Ivan Glasenberg, commented:
“Every aspect of life in 2020 has been impacted by the Covid-19 crisis. Our teams have adapted to these difficult conditions and we are pleased to announce an overall strong financial performance from our various businesses, reflecting the countercyclical earnings power from our large scale Marketing activities, combined with a cash generative industrial asset base, which quickly adapted to the changed environment.
Marketing delivered a half-yearly record Adjusted EBIT performance of $2.0 billion, allowing us to raise full-year guidance to the top end of our long-term $2.2-3.2 billion range. There were consistently good contributions across the board, however oil in particular was able to capitalise on the presence of exceptional market conditions during the half.
Our Industrial activities faced numerous challenges, but for the most part were able to continue operating relatively normally. Unit costs are broadly stable (pre by-product credits), while capex is under close control. In the current economic environment, difficult decisions and actions have been considered for moving certain assets into extended care and maintenance to rebalance markets with oversupply risk and preserve the resources for a better market environment. Impairments of $3.2 billion (net of non-controlling interests and tax) were recognised.
The outlook remains uncertain in the short term. Notwithstanding our cash-generative business and secure liquidity positions, the Board has concluded that it would be inappropriate to make a distribution to shareholders in 2020, instead prioritising the acceleration of Net debt reduction to within our target range (<$16 billion), currently expected to occur by the end of 2020.
Over the longer term, our diversified commodity portfolio, positions us well to play a key role in the next upward economic cycle, benefiting in particular from the commodities required for the transition to a low-carbon economy. We remain focussed on creating sustainable long-term value for all stakeholders.”
| US$ million | H1 2020 | H1 2019 | Change % | 2019 |
| Key statement of income and cash flows highlights1: | ||||
| Net (loss)/income attributable to equity holders | (2,600 ) | 226 | n.m. | (404) |
| Adjusted EBITDA◊ | 4,833 | 5,582 | (13) | 11,601 |
| Adjusted EBIT◊ | 1,472 | 2,229 | (34) | 4,151 |
| (Loss)/earnings per share (Basic) (US$) | (0.20) | 0.02 | n.m. | (0.03) |
| Funds from operations (FFO)2◊ | 3,686 | 3,516 | 5 | 7,865 |
| Cash generated by operating activities before working capital changes | 4,317 | 5,409 | (20) | 10,346 |
| Net purchase and sale of property, plant and equipment2◊ | 1,700 | 2,193 | (22) | 4,966 |
| US$ million | 30.06.2020 | 31.12.2019 | Change % |
| Key financial position highlights: | |||
| Total assets | 111,952 | 124,076 | (10) |
| Net funding2,3◊ | 36,361 | 34,366 | 6 |
| Net debt2,3◊ | 19,695 | 17,556 | 12 |
| Ratios: | |||
| FFO to Net debt2,3,4◊ | 40.8% | 44.8% | (9) |
| Net debt to Adjusted EBITDA3,4◊ | 1.81 | 1.51 | 20 |
1 Refer to basis of presentation on page 5.
2 Refer to page 9.
3 Includes $938 million (2019: $607 million) of Marketing related lease liabilities, excluding which, Net debt increased 11% period on period.
4 H1 2020 ratios based on last 12 months’ FFO and Adjusted EBITDA, refer to APMs section for reconciliation.
◊ Adjusted measures referred to as Alternative performance measures (APMs) which are not defined or specified under the requirements of International Financial Reporting Standards; refer to APMs section on page 69 for definition and reconciliations and to note 3 of the financial statements for reconciliation of Adjusted EBIT/EBITDA.
H1 Marketing Adjusted EBIT of $2.0 billion; full year expectation revised to the top end of our long-term range
- Marketing Adjusted EBIT of $2.0 billion (H1 2019: $1.0 billion) reflected oil, in particular, benefiting from the volatile and structurally supportive marketing environment. Metals also contributed significantly, reflecting the relatively quick economic recovery in China
- Full year Adjusted EBIT guidance now expected at the top end of our long-term $2.2-3.2 billion range
Industrial Adjusted EBITDA, a solid $2.6 billion in a challenging operating environment
- Metals $2.2 billion (down 16%) and Energy $0.7 billion (down 65%). The majority of our assets operated relatively normally through the half-year, with the Energy assets disproportionately impacted by lower coal prices
- H1 unit costs were: Copper 109¢/lb, zinc 28¢/lb (64¢/lb ex-gold), nickel (ex Koniambo) 230¢/lb and thermal coal $46/t
- Full year estimated unit costs: Copper 106¢/lb, zinc 5¢/lb (48¢/lb ex-gold), nickel (ex Koniambo) 257¢/lb and thermal coal $46/t
- Current industrial metals’ prices are substantially higher than H1 2020’s averages; augurs well for an improved Metals’ Industrial performance in H2
- H1 Industrial capex was $1.8 billion (H1 2019: $2.3 billion); full year expected around $4.0 billion (previous range of
$4.0-4.5 billion)
Net loss attributable to equity holders of $2.6 billion
- Net loss includes impairments attributable to equity holders of $3.2 billion recognised during the period as a result of lower commodity prices related to the economic uncertainty arising from the Covid-19 pandemic (notably thermal coal, oil and zinc) and / or technical reassessments resulting in reduced life of mine or longer-term project realisation expectations
- Total comprehensive loss attributable to equity holders of $4.2 billion (2019: income of $0.4 billion) includes exchange losses on translation of foreign operations and negative mark-to-market movements on investments held at fair value
Net debt of $19.7 billion (including $0.9 billion of Marketing-related lease liabilities)
- Net debt to Adjusted EBITDA ratio of 1.81 times is within our <2x cap.
- Net debt currently above the upper end of our $10-$16 billion target range; given current healthy levels of operating cash flow before working capital changes, expect Net debt to be inside our target range by end of 2020 and down from the start of the year
- Available committed liquidity of $10.2 billion at 30 June 2020 (31 December 2019: $10.1 billion)


