Ivanhoe Mines reports Q1 2023 finances and construction/exploration update
Kamoa-Kakula sold 86,777 tonnes of payable copper during the quarter and recognized record revenue of $689 million, as well as record EBITDA of $452 million
■
Ivanhoe Mines recorded Q1 2023 profit of $82 million, net of $31 million non-cash loss on the convertible bond fair valuation
■
Kamoa-Kakula produced 93,603 tonnes of copper in Q1 2023, including a record 34,915 tonnes of copper in March, following debottlenecking program completed ahead of schedule
■
Kamoa-Kakula’s quarterly cost of sales total $1.25 per lb. of payable copper; C1 cash costs of $1.42 per lb. towards the lower end of guidance
■
Kamoa-Kakula’s Phase 3 expansion on track for Q4 2024; boosting copper production to a ten-year average of 620,000 tonnes per annum, at C1 cash cost of $1.22/lb.
■
Ivanhoe Mines commences optimization work on installing hoisting capacity in Shaft 3 at the Tier-One Platreef palladium, nickel, platinum, rhodium, copper and gold mine in South Africa
■
Ivanhoe Mines agrees off-take terms with Gécamines and Glencore for 100% of Kipushi’s zinc concentrate, together with US$250 million facility
Ivanhoe Mines’ (TSX: IVN) (OTCQX: IVPAF) President Marna Cloete and Chief Financial Officer David van Heerden are pleased to present the company’s financial results for the three months ended March 31, 2023.
Ivanhoe Mines is a leading Canadian mining company that is advancing its four principal mining and exploration projects in Southern Africa: the Phase 3 expansion of the Kamoa-Kakula Copper Complex in the Democratic Republic of Congo (DRC) that commenced commercial operations in July 2021; the construction of the Platreef palladium, nickel, platinum, rhodium, copper and gold project in South Africa, scheduled for first production in the third quarter of 2024; the restart of the historic Kipushi zinc-copper-lead-germanium mine in the DRC, also scheduled for first production in the third quarter of 2024; and the exploration for new copper discoveries on Ivanhoe’s 2,407-square-kilometre Western Foreland exploration project, which is adjacent to Kamoa-Kakula. All figures are in U.S. dollars unless otherwise stated.
FINANCIAL HIGHLIGHTS
Ivanhoe Mines recorded a profit of $82 million for Q1 2023, compared to a profit of $22 million for the same period in 2022. The profit in the quarter is net of a $31 million non-cash loss on the fair value adjustment of the embedded derivative financial liability of the convertible bond, resulting predominantly from a 14% increase in the share price from C$10.70 per share to C$12.21 per share at quarter end. The profit includes Ivanhoe Mines’ share of profit and finance income from the Kamoa-Kakula joint venture of $130 million for Q1 2023.
Adjusted Q1 2023 EBITDA for the Ivanhoe Mines group of $168 million, compared to $145 million for the same period in 2022, and $162 million for Q4 2022, which includes an attributable share of EBITDA from Kamoa-Kakula.
During Q1 2023, Kamoa-Kakula sold 86,777 tonnes of payable copper and recognized record revenue of $689 million, with an operating profit of $416 million and record quarterly EBITDA of $452 million.
Kamoa-Kakula’s cost of sales per pound (lb.) of payable copper sold was $1.25/lb. for Q1 2023 compared with $1.08/lb. and $1.08/lb. in Q4 2022 and Q1 2022, respectively.
Cash costs (C1) per pound of payable copper produced in Q1 2023 totaled $1.42/lb., compared to $1.42/lb. and $1.21/lb. in Q4 2022 and Q1 2022, respectively.
Ivanhoe Mines has a strong balance sheet with cash and cash equivalents of $497 million on hand as at March 31, 2023, and expects Kamoa-Kakula’s Phase 1 and Phase 2 cash flow to be sufficient to fund the Phase 3 expansion capital cost requirements at current copper prices.
Off-take and financing terms agreed with Gécamines and Glencore to return Ivanhoe’s ultra-high-grade Kipushi Mine to production in Q3 2024; off-take term sheet for 100% of Kipushi’s zinc concentrate, together with a $250-million facility to finance construction.
OPERATIONAL HIGHLIGHTS
Kamoa-Kakula produced 93,603 tonnes of copper in Q1 2023, including a record 34,915 tonnes of copper in March 2023, following the completion of the debottlenecking program in late February 2023, ahead of schedule and on-budget.
Kamoa-Kakula’s Phase 1 and 2 concentrators have continued to perform strongly, achieving a daily mill throughput record of over 29,000 tonnes, and also achieving recoveries in excess of 88% during March and April, significantly higher than the design rate of 86%.
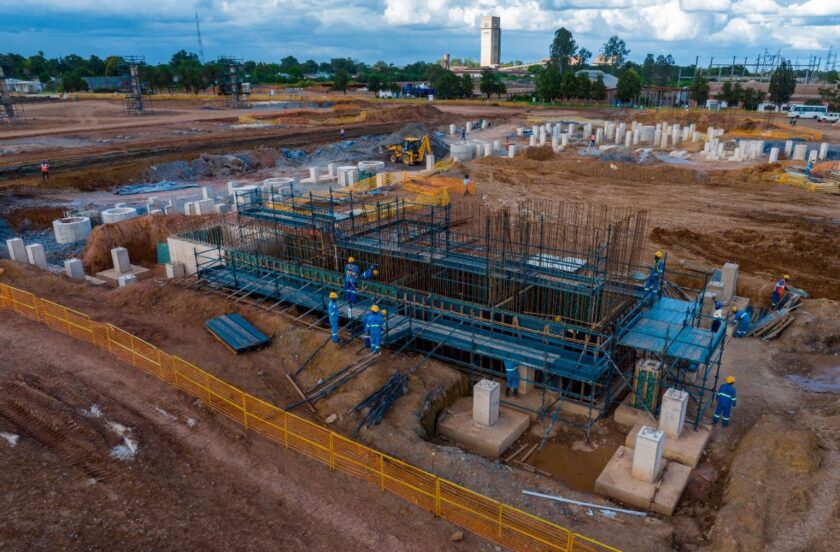
Construction for Platreef’s Phase 1 concentrator is advancing well and is on track for first production in Q3 2024. The Shaft 2 headgear concrete structure is complete to a height of approximately 79 metres. Shaft 2’s overall height will be approximately 100 metres above ground, including the steel structure housing the main winders.
Ivanhoe initiated an optimization study at Platreef to potentially accelerate production from the Phase 2 expansion. The study will consider the implications of converting the 5.1-metre-diameter ventilation shaft (Shaft 3), which is under construction, to a production shaft with the capability to hoist.
Surface construction activities and underground development of the Big Zinc orebody at Kipushi are advancing ahead of schedule, with first concentrate production expected in Q3 2024.
Ivanhoe continues its expansive copper exploration program on its Western Foreland licences that cover approximately 2,407 square kilometres adjacent to Kamoa-Kakula.
Diamond drilling commenced in early January with a single contractor rig, which was increased to three rigs by the end of March, together with an Ivanhoe Land Cruiser mounted diamond drill rig. A total of 4,883 meters of diamond core was drilled during the quarter, which was wet season.
Principal projects and review of activities
1. Kamoa-Kakula Copper Complex
39.6%-owned by Ivanhoe Mines
Democratic Republic of Congo
The Kamoa-Kakula Copper Complex operated as the Kamoa Holding joint venture between Ivanhoe Mines and Zijin Mining, has been independently ranked as the world’s third-largest copper deposit by international mining consultant Wood Mackenzie in 2027.
The project is approximately 25 kilometres southwest of the town of Kolwezi and about 270 kilometres west of Lubumbashi. Kamoa-Kakula Copper Complex’s Phase 1 concentrator began producing copper in May 2021 and achieved commercial production on July 1, 2021. The Phase 2 concentrator, which doubled nameplate production capacity, was commissioned in April 2022.
Ivanhoe sold a 49.5% share interest in Kamoa Holding Limited (Kamoa Holding) to Zijin Mining and a 1% share interest in Kamoa Holding to privately owned Crystal River in December 2015.
Kamoa Holding holds an 80% interest in the project. Ivanhoe and Zijin Mining each hold an indirect 39.6% interest in Kamoa-Kakula, Crystal River holds an indirect 0.8% interest, and the DRC government holds a direct 20% interest. Kamoa-Kakula’s employee workforce is currently 97% Congolese.
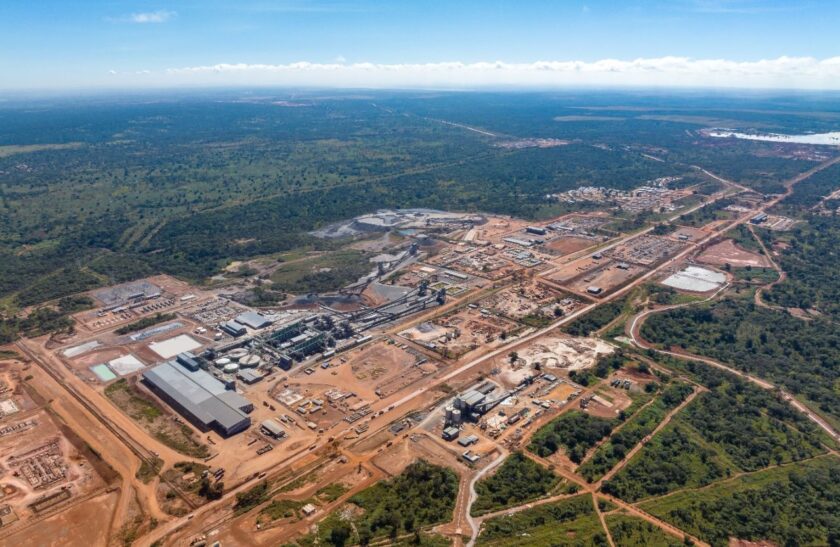
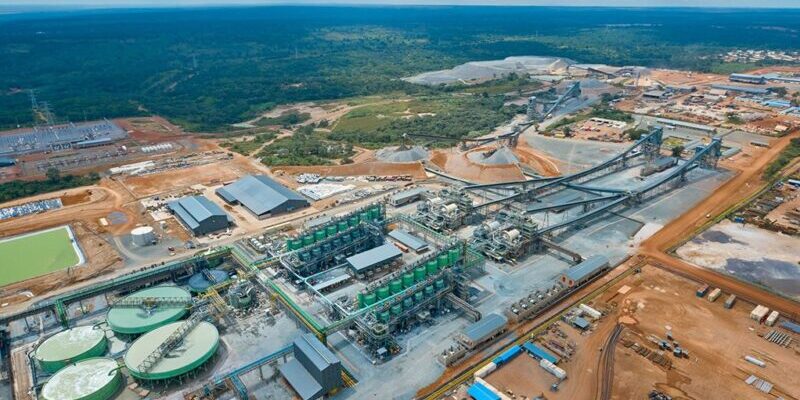
Aerial view of Kamoa-Kakula’s Copper Complex, which is now operating at a recently increased processing capacity of 9.2 million tonnes per annum, and production capacity of up to 450,000 tonnes of copper per annum.
Kamoa-Kakula summary of operating and financial data
Q1 2023 | Q4 2022 | Q3 2022 | Q2 2022 | Q1 2022 | |
| Ore tonnes milled (000’s tonnes) | 1,930 | 2,006 | 2,082 | 1,950 | 1,083 |
| Copper ore grade processed (%) | 5.42% | 5.40% | 5.60% | 5.44% | 5.91% |
| Copper recovery (%) | 87.1% | 86.1% | 85.9% | 84.0% | 87.1% |
| Copper in concentrate produced (tonnes) | 93,603 | 92,761 | 97,820 | 87,314 | 55,602 |
| Payable copper sold (tonnes) | 86,777 | 92,208 | 93,812 | 85,794 | 51,919 |
| Cost of sales per pound ($ per lb.) | 1.25 | 1.08 | 1.05 | 1.15 | 1.08 |
| Cash cost (C1) ($ per lb.) | 1.42 | 1.42 | 1.43 | 1.42 | 1.21 |
| Realized copper price ($ per lb.) | 4.04 | 3.54 | 3.50 | 4.34 | 4.51 |
| Sales revenue before remeasurement ($’000) | 659,529 | 619,997 | 570,504 | 699,381 | 467,453 |
| Remeasurement of contract receivables ($’000) | 29,594 | 53,473 | (110,031) | (205,248) | 52,142 |
| Sales revenue after remeasurement ($’000) | 689,123 | 673,470 | 460,473 | 494,133 | 519,595 |
| EBITDA ($’000) | 452,422 | 451,371 | 254,423 | 286,313 | 399,391 |
| EBITDA margin (% of sales revenue) | 66% | 67% | 55% | 58% | 77% |
All figures in the above tables are on a 100%-project basis. Metal reported in concentrate is before refining losses or deductions associated with smelter terms. This MD&A includes “EBITDA”, “Adjusted EBITDA”, “EBITDA margin” and “Cash costs (C1)” which are non-GAAP financial performance measures.
For a detailed description of each of the non-GAAP financial performance measures used herein and a detailed reconciliation to the most directly comparable measure under IFRS, please refer to the non-GAAP Financial Performance Measures section in the MD&A .
C1 cash cost per pound of payable copper produced can be further broken down as follows:
| Q1 2023 | Q4 2022 | Q3 2022 | Q2 2022 | Q1 2022 | ||
| Mining | ($ per lb.) | 0.41 | 0.40 | 0.41 | 0.39 | 0.30 |
| Processing | ($ per lb.) | 0.19 | 0.16 | 0.12 | 0.14 | 0.15 |
| Logistics charges (delivered to China) | ($ per lb.) | 0.46 | 0.50 | 0.56 | 0.51 | 0.36 |
| Treatment, refining and smelter charges | ($ per lb.) | 0.23 | 0.23 | 0.21 | 0.21 | 0.20 |
| General and administrative expenditure | ($ per lb.) | 0.13 | 0.13 | 0.13 | 0.17 | 0.20 |
| C1 cash cost per pound of payable copper produced | ($ per lb.) | 1.42 | 1.42 | 1.43 | 1.42 | 1.21 |
C1 cash costs are prepared on a basis consistent with the industry standard definitions by Wood Mackenzie cost guidelines but are not measures recognized under IFRS. In calculating the C1 cash cost, the costs are measured on the same basis as the Company’s share of profit from the Kamoa Holding joint venture that is contained in the financial statements.
C1 cash costs are used by management to evaluate operating performance and include all direct mining, processing, and general and administrative costs.
Smelter charges and freight deductions on sales to the final port of destination, which are recognized as a component of sales revenues, are added to C1 cash cost to arrive at an approximate cost of delivered, finished metal. C1 cash costs exclude royalties and production taxes and non-routine charges as they are not direct production costs.
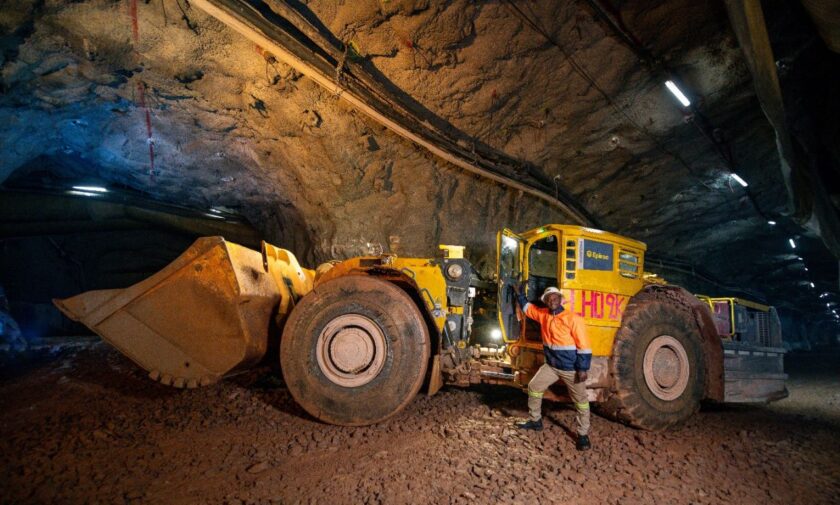
John Katumbwe, Scooptram (LHD) driver, developing the twin decline to the new Kamoa 1 and Kamoa 2 underground mines, which will be the source of copper ore for Kamoa-Kakula’s Phase 3 concentrator. Total copper production from Kamoa-Kakula is expected to increase to 600,000 tonnes per annum in Q4 2024.
Kamoa-Kakula produced 93,603 tonnes of copper in Q1 2023, including a record 34,915 tonnes of copper in March 2023
Kamoa-Kakula’s Phase 1 and 2 concentrators are now regularly operating at the increased processing rate of 9.2 million tonnes per annum (Mtpa), following the completion of the debottlenecking program.
The $50-million Phase 1 and 2 concentrator debottlenecking program was completed on budget and ahead of schedule in late February 2023, increasing production capacity up to 450,000 tonnes of copper in concentrate per annum.
All figures are on a 100% project basis and metal reported in concentrate is before refining losses or deductions associated with smelter terms.
Following the completion of the debottlenecking program in February, Kamoa-Kakula’s Phase 1 and 2 concentrators had a record-breaking month in March for copper production, including a monthly production record of 34,915 tonnes of copper in concentrate, in addition to a weekly production record of 9,016 tonnes in mid-March, and a daily production record of 1,563 tonnes on March 25, 2023.
These records were achieved following two scheduled plant shutdowns during the first quarter to tie in the new debottlenecking equipment. During the month of April, strong concentrator performance continued with a record daily mill throughput achieved of 29,206 tonnes of ore.
Kamoa-Kakula’s Phase 1 and 2 concentrators milled approximately 1.93 million tonnes of ore during the first quarter at an average feed grade of 5.42% copper. This included approximately 255,000 tonnes of ore from the surface stockpiles.
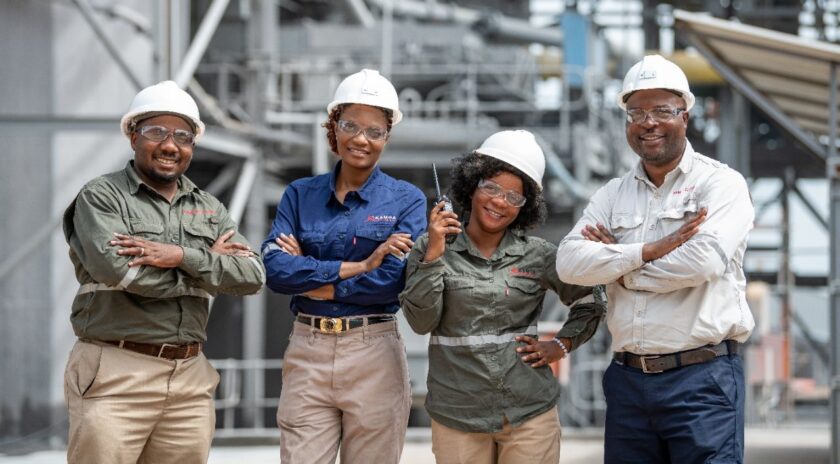
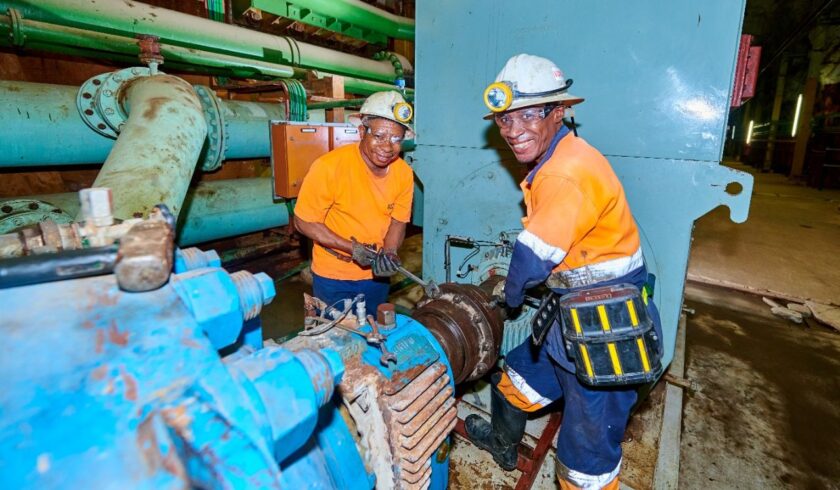
(L-R) Chris Tshibanda, Control Room Supervisor; Linda Malumda, Senior Operator Larox; Rachelle Museka, Mill Operator; Serge Mukembe, Control Room Supervisor at Kamoa-Kakula’s Phase 1 and Phase 2 concentrator facility, which is now operating at a throughput capacity of 9.2 Mtpa following the successful debottlenecking program.
The Phase 1 and Phase 2 concentrators also substantially outperformed design specifications in terms of copper recovery during the months of March and April. Copper recoveries averaged 88% and periodically exceeded 90% over a 24-hour periods. These record recoveries are significantly above Kamoa-Kakula’s nameplate 86% recovery rate.
The record monthly production in March was also achieved despite previously reported instability within the southern DRC grid.
In response to the instability in the southern DRC grid experienced since December 2022, Kamoa-Kakula, together with DRC state-owned power company SNEL, completed a study to tackle the vulnerabilities exposed in the grid network.
Grid stability improved during the month of April, following some initial infrastructure management and maintenance initiatives that SNEL introduced with support from Kamoa Copper. In addition, 60 MW of additional generation capacity from the recently refurbished Nseke hydroelectric power station was introduced into the DRC network. Further initiatives will continue to be implemented over the coming year, benefiting not only the Kamoa-Kakula Copper Complex, but all users of the DRC’s southern grid.
Kamoa-Kakula is also planning to protect operations from potential future grid instability with significantly increased on-site power generation capacity. The current installed backup generation capacity on-site is approximately 32 MW. Over time there is a plan to increase this to over 200 MW in a phased roll-out to achieve sufficient redundancy to meet the total power requirement for Phases 1, 2 and 3, excluding the smelter in situations where extended supply interruptions may occur.
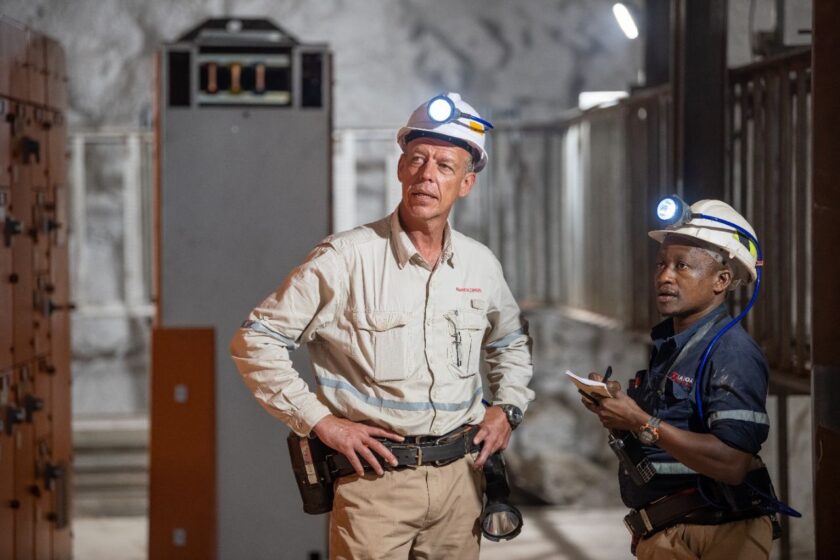
(L-R) Johan Prinsloo, Mine Overseer, and Thabo Kgaladi, Foreman, inspecting newly-installed panels at the new Kamoa 1 underground substation.
In the roll-out plan, an additional 11 MW is expected to be commissioned in Q2 2023 with a further 49 MW planned to be delivered to site towards the end of 2023. Study work is underway on further options for additional on-site backup power capacity, including renewable options, such as solar and hydro, together with battery storage.
Discussions are well advanced to secure up to an additional 100 MW of power from Copperbelt Energy Corporation (CEC) of Zambia, via the DRC-Zambia interconnector. An agreement is expected to be in place shortly.
Draw-down of surface ore stockpiles at Kakula continues as required; stockpiles hold approximately 4.2 million tonnes grading 3.9% copper, containing more than 161,000 tonnes of copper
Kamoa-Kakula’s high- and medium-grade ore surface stockpiles totaled approximately 4.2 million tonnes at an estimated grade of 3.9% copper as of the end of March 2023. Excluding any stockpile material, during Q1 2023 the operation mined 2.02 million tonnes of ore from the Kakula and Kansoko mines, grading 5.2% copper.
This comprised of 1.83 million tonnes of ore grading 5.6% copper from the Kakula Mine, including 0.75 million tonnes grading 6.7% copper from the mine’s high-grade centre.
While the ongoing expansion of underground infrastructure at the Kakula mine takes place, ore will be drawn as required from the stockpile to maximize copper production.
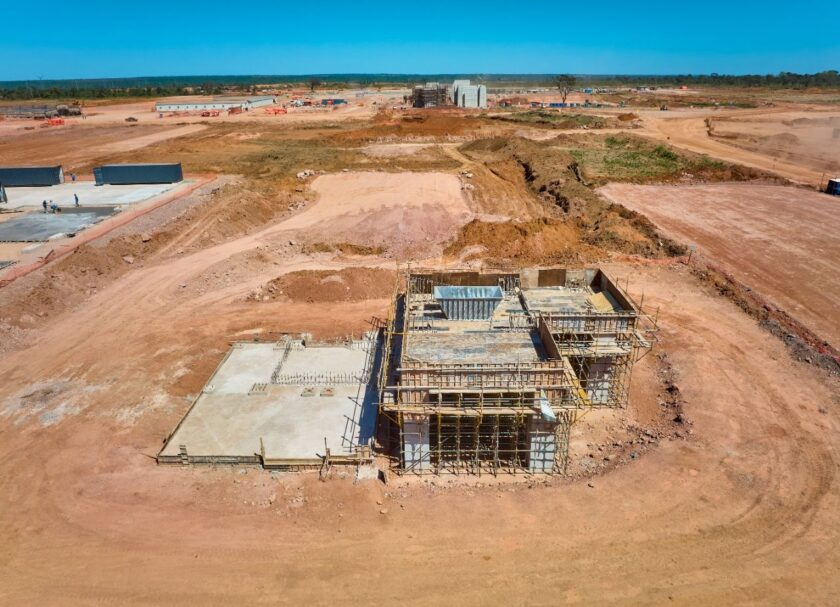
Civil construction for the Phase 3 concentrator plant and associated infrastructure is well advanced
Kamoa-Kakula’s ongoing Phase 3 expansion is expected to be commissioned in Q4 2024 and includes a new 5.0-million-tonne-per-annum (Mtpa) concentrator at Kamoa, which is approximately 10 kilometres north of the Phase 1 and 2 concentrators.
The process design of the Phase 3 concentrator is very similar to that of the Phase 1 and 2 concentrators, only larger. The front end of the concentrator (stockpile, crushing and screening) is being built to a capacity of 10 Mtpa, double the required capacity for Phase 3, in anticipation of the future Phase 4 expansion.
This follows the same construction approach as that of Phase 1 and Phase 2. The bulk of the equipment is the same or similar to that installed in the Phase 1 and 2 concentrators, resulting in a commonality of spare parts, while leveraging prior operational and maintenance experience.
Detailed design is nearing completion and procurement activities are advancing on schedule with all major equipment ordered and the first steel erection expected around June 2023. Earthworks are essentially complete and civil construction is well-advanced. The structural steel, piping and plate work (SMPP) construction contract is expected to be rewarded shortly.
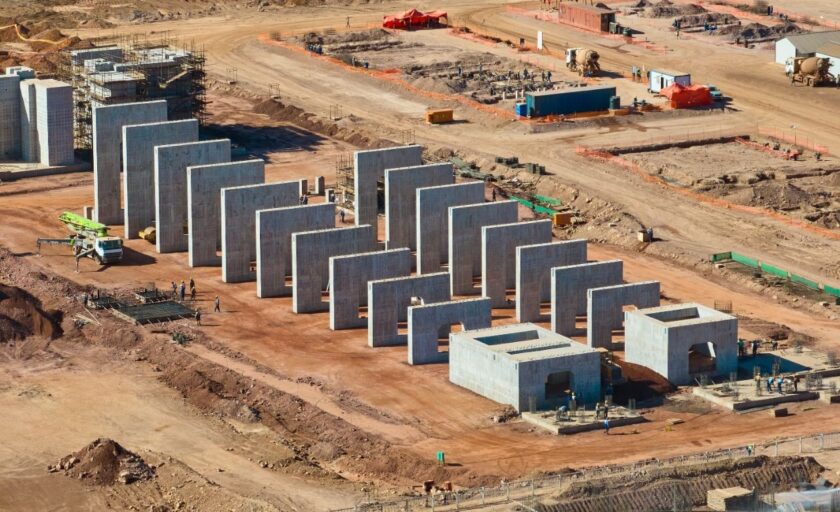
Erection of Kamoa-Kakula’s Phase 3 high-pressure grinding rolls (HPGR) building is well underway.
Civil construction on the foundation for Kamoa-Kakula’s Phase 3 flotation cells is also advancing well.
Following the commissioning of Phase 3, Kamoa-Kakula will have a total design processing capacity of 14.2 Mtpa. The completion of Phase 3 is expected to increase annualized copper production to an average of approximately 620,000 tonnes per year over the next ten years, which will position Kamoa Copper as the world’s third-largest copper mining complex in 2027, and the largest copper mine on the African continent. The mining crews developing the new Kamoa 1 and 2 mines, as part of the Phase 3 expansion, recently achieved 365 lost-time-injury-free days.
Construction of the twin declines to the Kamoa 1 and Kamoa 2 underground mines and excavation to access the Phase 3 mining areas is advancing well.
The Kamoa 1 and Kamoa 2 mines share a single box cut with a twin service-and-conveyor decline. Over 2,000 metres of development across both declines has been completed to date and access to the Kamoa 2 mine has been achieved. Underground mining activities are expected to commence at Kamoa 1 in late 2023 and Kamoa 2 in 2025, which will both involve the same mechanized drift-and-fill mining methods used at the Kakula Mine.
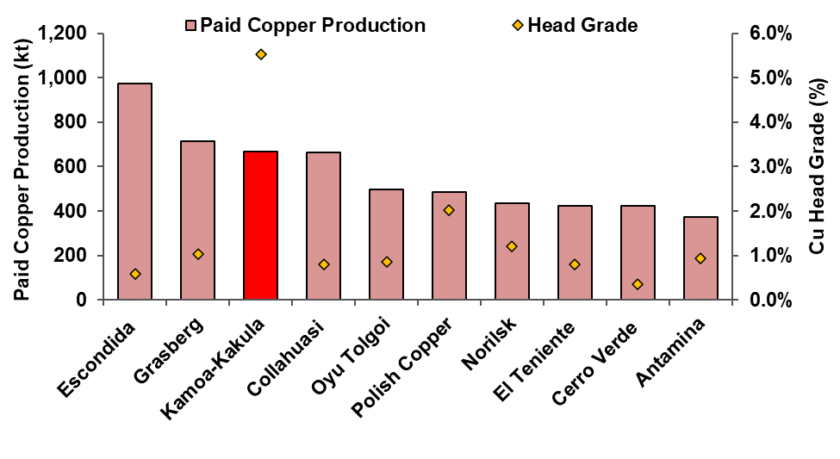
Figure 1. World’s projected top 10 copper mines in 2027, by key metrics.
Note: Kamoa-Kakula production and grade are based on the Kamoa-Kakula 2023 PFS. The ‘Cu Head Grade’ for the projects benchmarked by Wood Mackenzie reflects the average reserve grade.
Source: Wood Mackenzie, 2023 (based on public disclosure, the Kamoa-Kakula 2023 PFS has not been reviewed by Wood Mackenzie).
Construction activities for Kamoa-Kakula’s direct-to-blister flash copper smelter and the refurbishment of the Inga II hydroelectric facility are advancing on schedule
Kamoa-Kakula’s Phase 3 expansion includes a direct-to-blister flash copper smelter that will incorporate leading-edge technology supplied by Metso Outotec of Espoo, Finland.
The smelter is projected to be one of the largest, single-line copper flash smelters in the world, and the largest in Africa, with a production capacity of 500,000 tonnes per annum of 99+%-pure blister copper anodes. The 100-hectare smelter complex is being constructed adjacent to the Phase 1 and Phase 2 concentrator plants and is designed to meet the International Finance Corporation’s (IFC) emissions standards.
Smelter engineering, procurement and fabrication are advancing well and on schedule, with all major equipment currently being fabricated. Construction activities on the direct-to-blister flash copper smelter are advancing on schedule and the overall project is approximately 42% complete.
The bulk of the terracing earthworks for the smelter complex were completed in 2022 and the civil construction is now well advanced, with the erection of structural steel well underway. The first batch of furnace steel arrived on site in January 2023. The smelter is on schedule for commissioning by the end of 2024.
The smelter will have a processing capacity of approximately 1.2 Mtpa of dry concentrate feed and is designed to run on a blend of concentrate produced from the Kakula (Phase 1 and 2) and Kamoa (Phase 3 and future Phase 4) concentrators.
Under the Kamoa-Kakula 2023 PFS, the smelter is projected to accommodate approximately 80% of Kamoa-Kakula’s total concentrate production, including that from Phase 3 and the future Phase 4 expansion.
Kamoa-Kakula will continue to toll-treat concentrates under the 10-year agreement with the Lualaba Copper Smelter, located near the town of Kolwezi approximately 50 kilometres from Kamoa-Kakula, which is expected to account for approximately 150,000 tonnes of copper concentrate annually. The balance of copper production will be exported as concentrate.
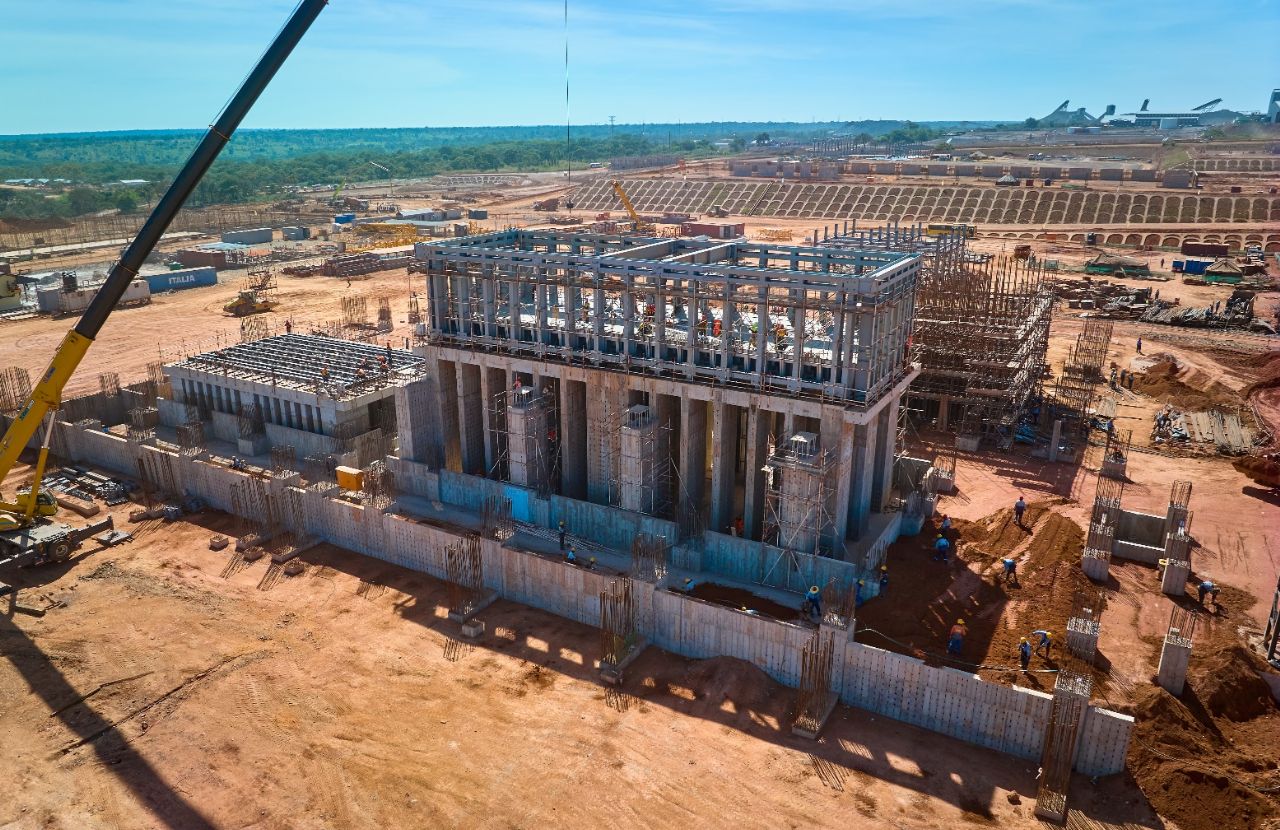
Construction of the smelter building, which will house Kamoa-Kakula’s direct-to-blister furnace, is progressing well.
As a by-product, the smelter will also produce between 650,000 and 800,000 tonnes per annum of high-strength sulphuric acid that is expected to be sold in the domestic DRC market.
The on-site smelter will offer transformative financial benefits for the Kamoa-Kakula Copper Complex, most notably of which is a material reduction in logistics costs, and to a lesser extent reduced concentrate treatment charges and local taxes, as well as revenue from the acid sales. Logistics costs alone accounted for 32% of Kamoa-Kakula’s total cash costs (C1) during Q1 2023, and the volume of shipments per unit of copper will be more than halved by selling 99+%-pure blister copper anodes instead of copper concentrate. According to the Kamoa-Kakula 2023 PFS, smelter commissioning is expected to drive a decrease in average cash costs (C1) over the first five years (from 2025) to approximately $1.15/lb. of copper, a 21% reduction from the midpoint of the 2023 guidance of $1.45/lb. of payable copper produced.
Kamoa-Kakula’s Phase 3 expansion also includes the replacement of Turbine #5 at the Inga II hydroelectric power station. The turbine replacement will supply an additional 178 megawatts (MW) of clean hydroelectric power to the national grid and provide power for Phase 3.
Rehabilitation work at the Inga II facility is advancing well, with the team from lead-contractor Voith Hydro mobilized to the Inga II site in Q4 2022. Dismantling works on the existing alternator are ongoing, as well as the fabrication of a new runner. Study work is also progressing well to upgrade the transmission capacity of the existing grid infrastructure between the Inga II hydropower facility and the Kamoa site.
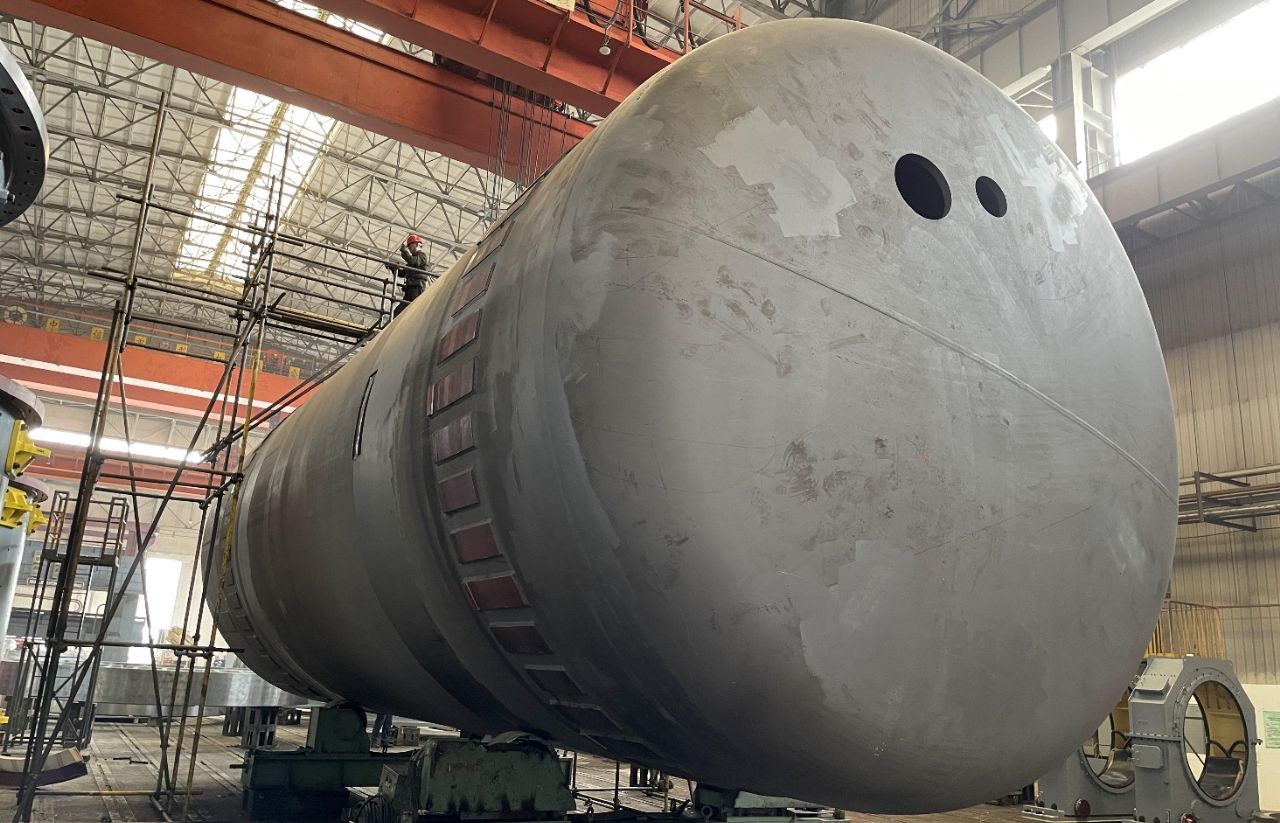
Manufacturing is underway on Kamoa-Kakula’s anode furnace shell for the direct-to-blister smelter.
Outstanding economic results of updated, independent Integrated Development Plan (2023 IDP) for world-leading Kamoa-Kakula Copper Complex
Ivanhoe Mines announced the results of an updated independent Integrated Development Plan (2023 IDP) for the Kamoa-Kakula Copper Complex on January 30, 2023. The 2023 IDP consists of a Pre-Feasibility Study (Kamoa-Kakula 2023 PFS) for the Phase 3 and Phase 4 expansions of the Kamoa-Kakula Copper Complex over a 33-year mine life, as well as an updated Preliminary Economic Assessment (Kamoa-Kakula 2023 PEA) that includes a life-of-mine extension case to 42 years overall.
The Kamoa-Kakula 2023 PFS (Phase 3 and 4 expansion) plans for a staged increase in nameplate processing capacity from the current combined capacity of 9.2 Mtpa, up to a total of 19.2 Mtpa.
The Phase 1 and 2 concentrators will continue to process ore from the Kakula Mine, as well as the new adjacent Kakula West Mine from 2029. The Phase 3, 5.0 Mtpa concentrator, which is under construction and on target for the first concentrate in Q4 2024, will be fed with ore from the existing Kansoko Sud Mine (formerly Kansoko Mine), as well as new mines currently under development in the Kamoa area, known as Kamoa 1 and 2.
The Phase 4 expansion consists of an additional 5.0 Mtpa concentrator that will take the total processing capacity of the Kamoa-Kakula Copper Complex up to 19.2 Mtpa. The Phase 4 concentrator will be fed by new mines in the Kamoa area.
The completion of the Phase 3 expansion in Q4 2024 is planned to coincide with the commissioning of an on-site, direct-to-blister flash copper smelter capable of producing 500,000 tonnes per annum of copper anode.
Highlights of the Kamoa-Kakula 2023 PFS (Phase 3 and 4 expansion) include:
Phase 1 and 2 at steady-state throughput (9.2 Mtpa) for the first two years, following the completion of the debottlenecking program by Q2 2023, generating cash flow to fund the ongoing capital expenditures.
Phase 3 expansion to 14.2 Mtpa processing capacity from late 2024 drives a significant increase in copper production, which is forecast to average 620,000 tonnes during the first ten years.
Commissioning of the 500,000 tonne-per-annum smelter in conjunction with Phase 3 results in a significant improvement in operating cost.
A significant period of cash flow generation in the first five years following Phase 3 (2025 to 2029) with copper production averaging approximately 650,000 tonnes at a cash cost (C1) of $1.15/lb.
Phase 4 expansion, ramping up 19.2 Mtpa processing capacity after 2030, will allow sustained copper production of over 500,000 tonnes per year through 2047.
The remaining Phase 3 capital cost, including contingency, is $3.04 billion, excluding $255 million already spent through December 2022. Of the $3.04 billion, $2.53 billion is spent during 2023 and 2024 up to the commissioning of the Phase 3 concentrator, with the remaining capital cost for the continuing ramp-up of the mining operations thereafter.
After-tax NPV, at an 8% discount rate, of $19.1 billion and a mine life of 33 years at a long-term copper price of $3.70/lb.
The Kamoa-Kakula 2023 PEA (Life-of-mine extension case) projects a nine-year mine life extension of the Kamoa-Kakula Copper Complex, in addition to the Kamoa-Kakula 2023 PFS. This case includes the addition of four new underground mines in the Kamoa area (called Kamoa 3, 4, 5 and 6) to maintain the overall throughput rate of up to 19.2 Mtpa.
Highlights of the Kamoa-Kakula 2023 PEA (Life-of-mine extension case) include:
Life-of-mine extension case shows the potential to maintain the processing rate at up to 19.2 Mtpa for an additional 9 years beyond the 33 years in the Kamoa-Kakula 2023 PFS.
The sequential ramp-up of four new underground mines in the Kamoa area (called Kamoa 3, 4, 5 and 6) providing an additional 181.2 Mt of feed to the Kamoa and Kakula concentrators at an average grade of 3.1% copper, producing an additional 4.8 Mt of contained copper in concentrate.
After-tax NPV, at an 8% discount rate, of $20.2 billion and mine life of 42 years.
The Kamoa-Kakula 2023 PEA is preliminary and includes an economic analysis that is based, in part, on Inferred Mineral Resources. Inferred Mineral Resources are considered too speculative geologically for the application of economic considerations that would allow them to be categorized as Mineral Reserves – and there is no certainty that the results will be realized. Mineral Resources do not have demonstrated economic viability and are not Mineral Reserves.
Copper production and cash cost guidance for 2023
| Kamoa-Kakula 2023 Guidance | |
| Contained copper in concentrate (tonnes) | 390,000 to 430,000 |
| Cash cost (C1) ($ per pound) | 1.40 to 1.50 |
The figures are on a 100%-project basis and metal reported in concentrate is before refining losses or deductions associated with smelter terms. Kamoa-Kakula’s 2023 guidance is based on several assumptions and estimates and involves estimates of known and unknown risks, uncertainties and other factors that may cause the actual results to differ materially.
Production guidance is based on assumptions about the disruption of power supply, among other things. The Kamoa-Kakula joint venture produced a total of 333,497 tonnes of copper in concentrate for the year ending December 31, 2022, and 93,603 tonnes in the first quarter of 2023 including 34,915 tonnes of copper in concentrate in March 2023.
Cash costs (C1) per pound of payable copper amounted to $1.42 for Q1 2023 and to $1.42 for the fourth quarter of 2022.
Cash cost (C1) guidance is based on assumptions including, among other things, prevailing logistics costs based on estimated regional trucking capacity, particularly as regional idled operations are expected to come online, as well as increased benchmark treatment and refining charges, and inflation in consumables and other inputs.
C1 cash cost is a non-GAAP measure used by management to evaluate operating performance and includes all direct mining, processing, stockpile rehandling charges, and general and administrative costs. Smelter charges and freight deductions on sales to the final port of destination (typically China), which are recognized as a component of sales revenues, are added to C1 cash cost to arrive at an approximate cost of delivered finished metal.
For historical comparatives, see the non-GAAP Financial Performance Measures section of the MD&A.
2. Platreef Project
64%-owned by Ivanhoe Mines
South Africa
The Platreef Project is owned by Ivanplats (Pty) Ltd (Ivanplats), which is 64%-owned by Ivanhoe Mines. A 26% interest is held by Ivanplats’ historically disadvantaged, broad-based, black economic empowerment (B-BBEE) partners, which include 20 local host communities with approximately 150,000 people, project employees and local entrepreneurs. A Japanese consortium of ITOCHU Corporation, Japan Oil, Gas and Metals National Corporation, and Japan Gas Corporation, owns a 10% interest in Ivanplats, which it acquired in two tranches for a total investment of $290 million.
The Platreef Project hosts an underground deposit of thick, platinum-group metals, nickel, copper, and gold mineralization on the Northern Limb of the Bushveld Igneous Complex in Limpopo Province – approximately 280 kilometres northeast of Johannesburg and eight kilometres from the town of Mokopane.
On the Northern Limb, platinum-group metals mineralization is primarily hosted within the Platreef, a mineralized sequence traced for more than 30 kilometres along the strike. Ivanhoe’s Platreef Project, within the Platreef’s southern sector, is comprised of two contiguous properties: Turfspruit and Macalacaskop. Turfspruit, the northernmost property, is contiguous with, and along strike from, Anglo Platinum’s Mogalakwena group of mining operations and properties.
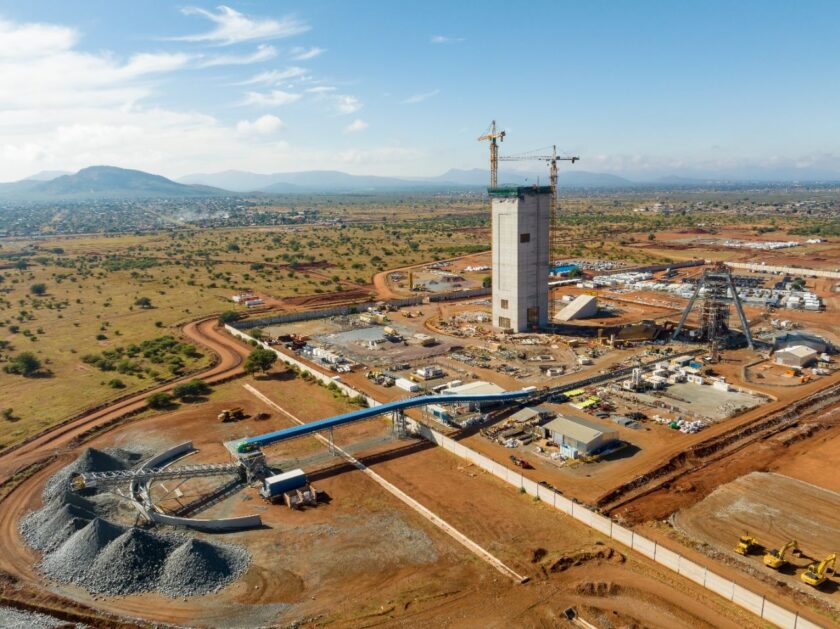
Aerial photo dated April 2023 of the Platreef mine site, with Shaft 1 on the right and Shaft 2, which has reached 79 metres in height, on the left.
Since 2007, Ivanhoe has focused its exploration and development activities on defining and advancing the down-dip extension of its original discovery at Platreef, now known as the Flatreef Deposit, which is amenable to highly mechanized, underground mining methods. With Shaft 1, the initial access to the deposit, now in operation and hoisting development rock from underground, Ivanhoe is focusing on construction activities to bring Phase 1 of Platreef into production by Q3 2024.
Platreef development is currently funded by $300-million stream financing, with efforts to finalize an additional senior debt facility targeted for completion in mid-2023.
Surface construction activities and lateral underground mine development are progressing well
Underground development work has been focused on the vertical development of waste passes between the 750-metre, 850-metre and 950-metre levels, and lateral development towards the orebody, as well as lateral development required for underground infrastructure on each level including access to the bottom of Shaft 3 on the 950-metre level. Shaft 3, with a diameter of 5.1 metres, is currently being reamed with approximately 150 metres of 950 metres completed to date, with planned completion in Q4 2023. More than 1,700 metres of lateral development has been completed to date across all three levels, as well as over 200 metres of vertical development between the three levels.
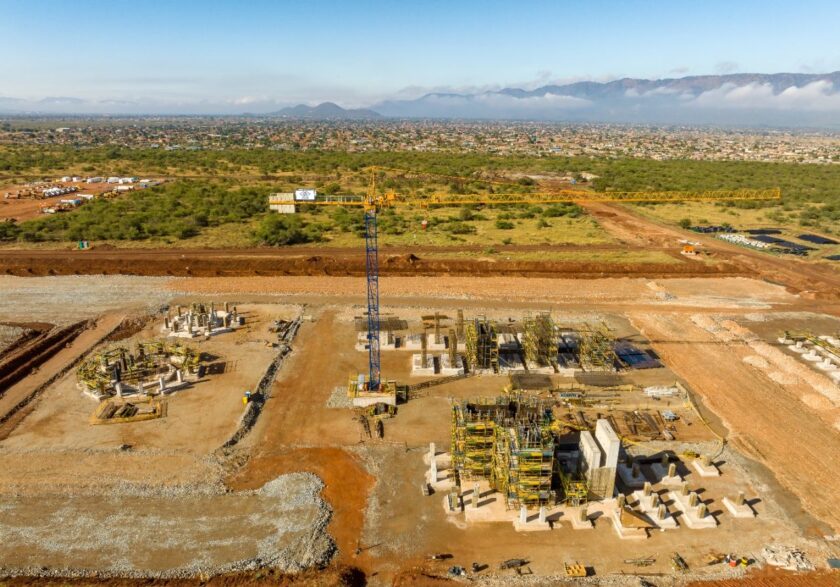
Construction for Platreef’s Phase 1 concentrator has commenced, including the concentrate thickener and tailings thickener (on the left) and the flotation cells (on the right).
Construction for Platreef’s Phase 1 concentrator has commenced, with the first production on schedule for Q3 2024. Earthworks and civils are well advanced and progressing on schedule.
Long-lead equipment orders were placed with the majority of items scheduled for delivery in Q3 2023. The SMPP contractor has been appointed and mobilization to the site has commenced. Over 800 tonnes of structural steel are in fabrication, with over 160 tonnes ready for delivery. The electrical, control & instrumentation (EC&I) contract award is planned for mid-2023 with site mobilization expected in Q3 2023.
The 10-metre diameter Shaft 2 currently under construction will have a hoisting capacity of 8 Mtpa. Shaft 2 will be utilized in subsequent development phases and will be among the largest hoisting shafts in the world. The Shaft 2 headgear concrete structure has been completed to a height of approximately 79 metres. Shaft 2’s overall height will be approximately 100 metres above ground, including the steel structure housing the main winders.
Drilling of the pilot drill in Shaft 2 down to the shaft bottom commenced in Q1 2023. A total of 680 metres have already been completed with drilling on schedule to finish during Q2 2023, whereafter reaming of a 3.1-metre diameter hole is planned.
Construction of Platreef’s first 5 MW solar-power plant commenced in Q4 2022 with commissioning expected later this year. The power generated by this plant will support development activities and operations, together with other renewable energy sources to be introduced over time.
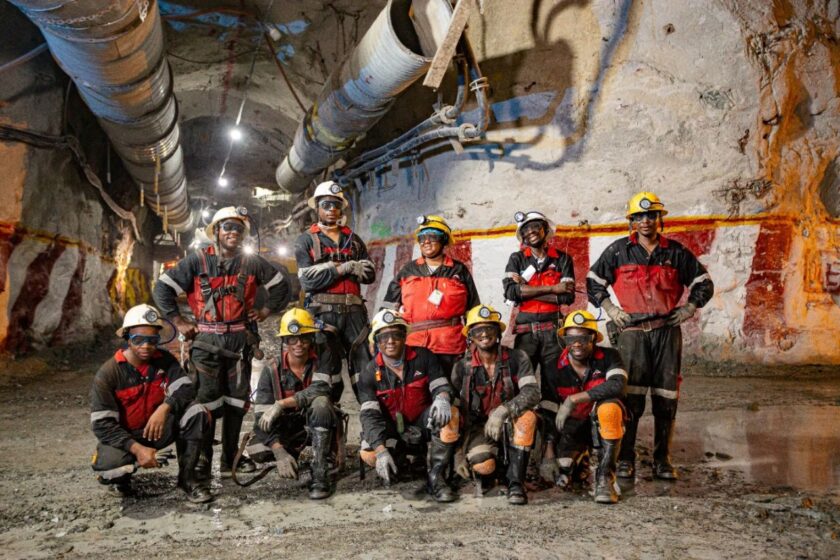
Mining crew underground on Platreef’s 950-metre level, where mine development is underway ahead of Phase 1 first production, which is expected in Q3 2024.
Optimization work is underway to potentially accelerate Platreef’s Phase 2 expansion
Ivanhoe has initiated optimization work to identify value-accretive options for installing hoisting capacity in Shaft 3. Shaft 3, originally planned as a ventilation and second escape shaft, is currently under construction and is now planned to be equipped for hoisting, which will provide additional hoisting capacity to remove ore and waste from the underground mine.
This has the benefit of de-risking the development and ramp-up of the Phase 1 mine and may be used to accelerate the ramp-up of underground mining activities for Phase 2, in advance of the completion of Shaft 2, which is expected in 2027.
The Shaft 3 design and engineering order has been placed and the required rock winder for Shaft 3 has been secured.
3. Kipushi Project
68%-owned by Ivanhoe Mines
Democratic Republic of Congo
The Kipushi zinc-copper-germanium-silver-lead mine in the DRC is adjacent to the town of Kipushi, approximately 30 kilometres southwest of Lubumbashi on the Central African Copper Belt. Kipushi is approximately 250 kilometres southeast of the Kamoa-Kakula Copper Complex and less than one kilometre from the Zambian border.
Ivanhoe acquired its 68% interest in the Kipushi Project in November 2011, through Kipushi Holding which is 100%-owned by Ivanhoe Mines. The balance of 32% in the Kipushi Project is held by the state-owned mining company, Gécamines.
The 2022 feasibility study focuses on the mining of Kipushi’s zinc-rich Big Zinc and Southern Zinc zones, with an estimated 11.8 million tonnes of Measured and Indicated Mineral Resources grading 35.3% zinc. Kipushi’s exceptional zinc grade is more than twice that of the world’s next- highest-grade zinc project, according to Wood Mackenzie, a leading, international industry research and consulting group.
On April 27, 2023, Ivanhoe Mines announced the signing of a tri-partite off-take and financing term sheet between Kipushi Corporation SA, Gécamines and Glencore International AG (Glencore) to return the historic Kipushi zinc-copper-lead-germanium mine to production.
The off-take is for 100% of Kipushi’s zinc concentrates; between 400,000 and 600,000 dry metric tonnes per annum over a five-year term. The off-take term sheet contains standard, international commercial terms, including payables and treatment charges based on the zinc industry’s annual benchmark.
The concentrate produced by Kipushi is expected to contain approximately 55% zinc and low levels of impurities. The buyer will purchase the concentrate at the Kipushi Mine on a free-carrier basis, meaning the buyer will be responsible for arranging freight and shipment to the destination, with such costs reimbursed by Kipushi.
The $250 million term financing facility will be split into two tranches and drawn down quarterly, subject to conditions precedent. The facility will bear an annual interest rate of the Secured Overnight Financing Rate (SOFR) plus 7% and shall be repaid, following a 24-month grace period from signing, in quarterly instalments over 36 months.
The off-take and financing term sheet is subject to the execution of final, binding agreements, which are expected to be concluded in conjunction with the new Kipushi joint-venture agreement.
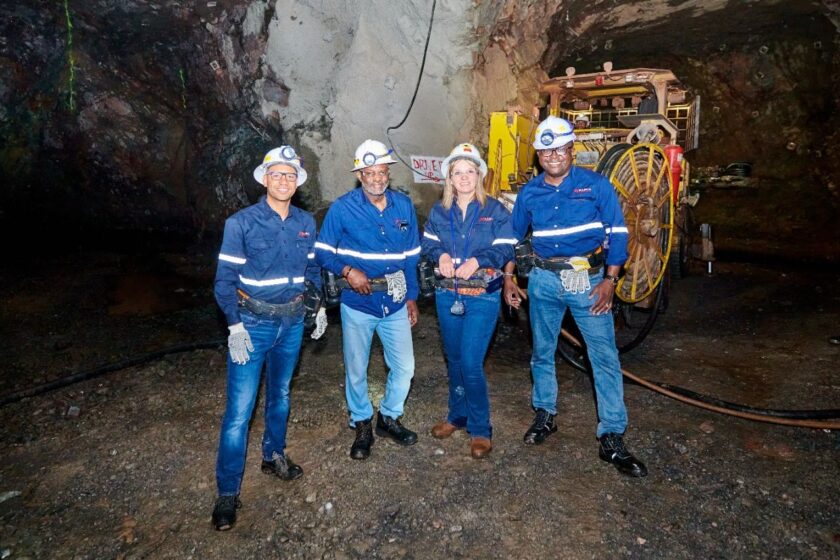
(L-R) Olivier Binyingo, SVP Public Affairs DRC, Ivanhoe Mines; Placide Nkala Basadilua, GM, Gécamines; Marna Cloete, President, Ivanhoe Mines; and Guy-Robert Lukama Nkunzi, Chairman, Gécamines, during an underground visit to Kamoa-Kakula Copper Complex, following the signing of the off-take and financing term sheet at Kipushi.
As previously reported, Kipushi Holding and Gécamines signed a new agreement to return the ultra-high-grade Kipushi Mine to commercial production in Q1 2022, which sets out the commercial terms that will form the basis of a new Kipushi joint-venture agreement establishing a robust framework for the mutually beneficial operation of Kipushi for years to come and are subject to execution of definitive documentation.
Once the agreement is concluded, it is anticipated that Ivanhoe Mines’ ownership in the Kipushi Project will reduce to 62%, with Gécamines holding the balance of 38%.
Surface construction activities are advancing on schedule to return Kipushi to production in Q3 2024
Civil work on Kipushi’s processing plant is nearing completion, with site and steel erection now underway.
Detailed design for the Kipushi concentrator and associated surface infrastructure is effectively complete, with procurement activities well advanced.
Fabrication is advancing well and on schedule with all major equipment currently being fabricated. The bulk of the earthworks and civil works is nearing completion and steel erection has started. The ball mill, currently being fabricated by CITIC Heavy Industries in China, is on track and site delivery is planned for Q3 2023. First concentrate is on schedule to occur in Q3 2024.
Underground development work at Kipushi advancing ahead of schedule, access drive development focused around the top of the Big Zinc orebody
Underground mine development around Kipushi’s Big Zinc orebody is advancing ahead of schedule. Stope perimeter drives are being developed on the 1,245m, 1,260m, 1,290m and 1,320m levels, with stope access development at the 1,335-metre level advancing well. Waste rock and low-grade mineralized rock from the advancement of the perimeter and access drives are being hoisted to the surface through Shaft 5 and stockpiled.
A total of 682 metres of underground development was completed within the mining footprint area during Q1 2023. Underground development continued along the critical path whilst additional resources are being mobilized. The first two Epiroc double boom drill rigs arrived on site and have safely been delivered underground and assembled in the workshop on the 1,150-metre level.
Shaft 5 is planned to be the main production shaft once operations commence, with a maximum hoisting capacity of up to 1.8 Mtpa. The bottom of Shaft 5 provides primary access to the lower levels of the mine, including the Big Zinc orebody, along the 1,150-metre haulage level.
Mining will be conducted using highly productive, mechanized methods. Cemented rock fill, utilizing discarded material from the Dense Media Separation (DMS) plant, will be used to backfill open stopes, this will reduce surface tailings volumes and maximize ore extraction.
Stoping of the Big Zinc orebody is expected to commence in early 2024, to build a high-grade ore stockpile ahead of processing plant commissioning in Q3 2024.
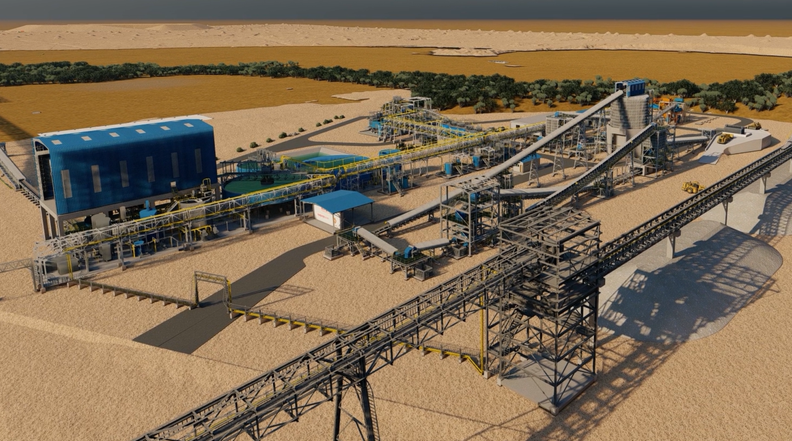
3D rendering of the Kipushi 800,000 tonnes-per-annum concentrator. scheduled to produce first concentrate in Q3 2024.
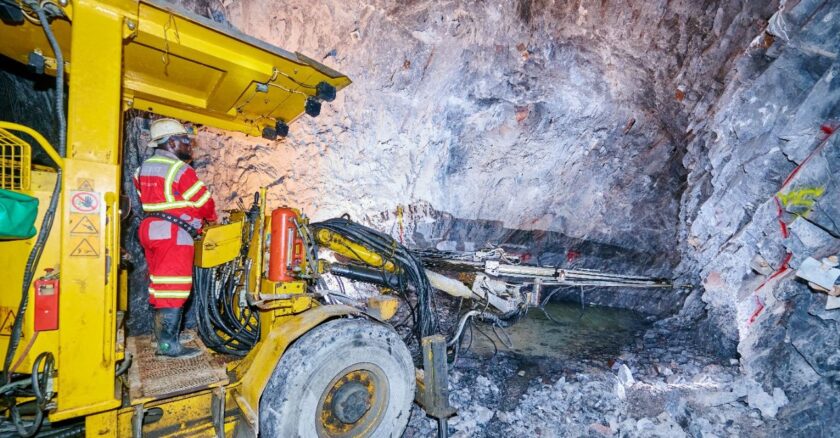
Eutychus Phiri, Drill Operator, operating a drilling rig on Kipushi’s 1,335-metre level. At the end of the first quarter, underground development was advancing ahead of schedule
Mechanics Ndaye Ngoie and Banza Ngoie perform routine maintenance at Kipushi’s 1,200-metre-level pump station.
Dedicated Kipushi commercial border crossing to unlock direct access to Zambia
Kasumbalesa and Sakania, in Haut-Katanga, are the two commercial border crossings that currently handle most imports and exports originating from the DRC Copperbelt.
They are located 110 kilometres and 230 kilometres by road southeast of Kipushi, respectively. The Kasumbalesa border experienced significant congestion in 2022 and Ivanhoe Mines has been working with the provincial government of Haut-Katanga on a series of initiatives to reduce border congestion and streamline the process of clearing mineral products for export.
One such initiative included a Memorandum of Understanding (MOU), signed in Q3 2022, between the province of Haut-Katanga and Ivanhoe Mines, to study options for a new commercial DRC-Zambia border crossing at the town of Kipushi.
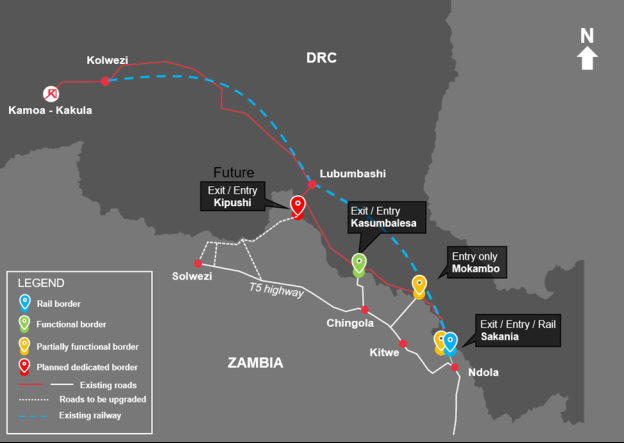
Figure 2. Map of the current and planned commercial DRC-Zambia border infrastructure.
A new commercial DRC-Zambia border crossing at Kipushi will not only benefit the Kipushi Mine but also Kamoa-Kakula as an additional route for exporting concentrate products. In addition, the border crossing will provide socio-economic benefits to the local community of Kipushi and Lubumbashi, the capital of Haut-Katanga province, which is less than 20 kilometres away.
Initial studies have been completed and the various options presented are currently under review by the provincial government of Haut-Katanga and are being discussed with the national authorities in the DRC. Concurrently, a study is underway to upgrade roads for commercial traffic on the Zambian side of the border, connecting the T5 highway to the Kipushi border (See Figure 2). The Zambian government has already commenced improvements on some sections, with further infrastructure upgrades and all-weather proofing planned to take place over the next 12 to 18 months.
4. Western Foreland Exploration Project
90%- to 100%-owned by Ivanhoe Mines
Democratic Republic of Congo
Ivanhoe’s DRC exploration group is targeting Kamoa-Kakula-style copper mineralization on its Western Foreland exploration licences. The 17 licences in the Western Foreland cover a combined area of 2,407 square kilometres to the north, south and west of the Kamoa-Kakula Copper Complex. The exploration group is using models that successfully led to the discoveries of Kakula, Kakula West, and the Kamoa North Bonanza Zone on the Kamoa Copper SA mining licence. The group is composed of a mixture of the same exploration geologists responsible for the previous discoveries and others with experience in the greater Copper Belt.
Diamond drilling began in early January with a single contractor rig, which was increased to three rigs by the end of March, together with an Ivanhoe Land Cruiser mounted diamond drill rig. A total of 4,883 meters of diamond core was drilled during the quarter, which was the wet season.
No ground geophysics data acquisition was carried out in the quarter due to the wet season, but density, magnetic susceptibility and conductivity data have been collected from core samples. Significant advances have been made in understanding ground gravity collected in 2022 and how this can be used as a targeting tool in the Western Foreland shelf. Exploration activities will now be entering the dry season, until Q4 2023 when the wet season occurs.
An update of the Makoko stratigraphic model was completed in Q1 2023 in preparation for the Mineral Resource estimate for the Western Foreland’s Makoko and Kiala high-grade copper discoveries, planned for mid-year.
Western Foreland’s 2023 exploration program is budgeted at approximately $19 million, including up to 70,000 metres of drilling.
5. The Mokopane Feeder Exploration Project
100%-owned by Ivanhoe Mines
South Africa
Three new 100%-owned exploration rights were granted on the Northern Limb of the Bushveld complex in South Africa during Q4 2022. The three new exploration rights (Blinkwater 244KR, Moordrift 289KR and Lisbon 288KR) cover 80 square kilometres forming a continuous block situated on the southwest border of the existing Platreef Project’s mining rights.
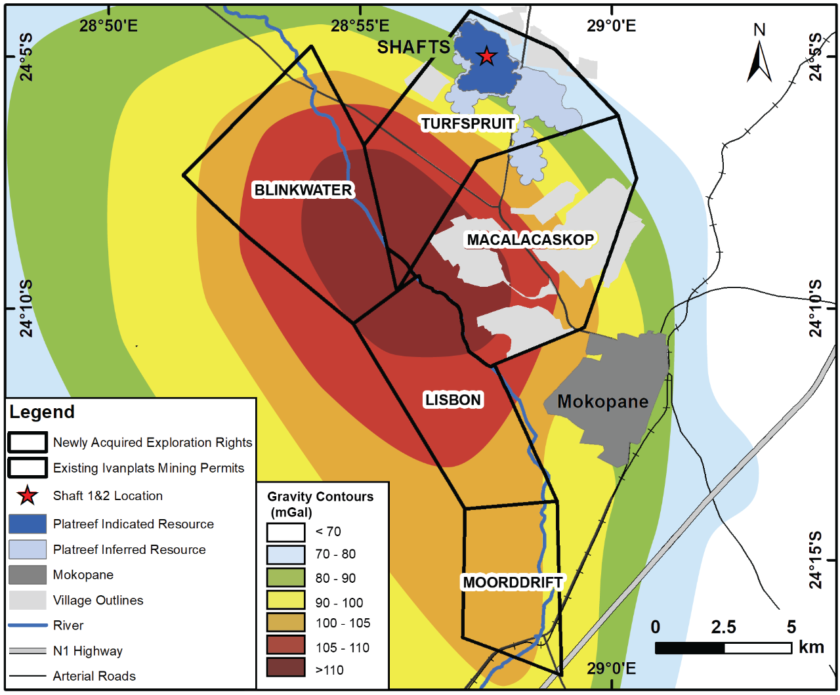
Figure 3. Image of the Platreef and Mokopane Feeder licences overlaid on the gravity geophysics anomaly.
The three new exploration rights together with Ivanhoe’s existing properties cover a large geophysical gravity anomaly that was previously identified from a widely spaced regional ground gravity survey.
Academic studies based on historical data hypothesize that the anomaly represents a primary feeder zone to the Rustenburg Layered Suite of the Northern Limb of the Bushveld Complex. Significant thickening of the Rustenburg Layered Suite, particularly of the more-dense Lower Zone units, is necessary to explain the large gravity anomaly.
The proximity of the proposed feeder to the regional-scale crustal faults (the Ysterberg-Planknek and the Zebediela faults), as well as the anomalously thick zones of platinum-group metals mineralization at the Platreef Deposit, lead Ivanhoe to believe there is significant potential for mineralization to be associated with this gravity feature.
A detailed high-resolution, airborne-magnetic and gradiometer-gravity geophysical survey is currently being flown to better understand the conceptual target. Two separate surveys, a high-resolution magnetic and a wider-spaced Falcon gravity survey, are being flown. The magnetic survey was 50% complete at quarter end, with the gravity survey to follow thereafter. Diamond drilling will be conducted later in the year on targets identified from the results of the two surveys.
Safety and Sustainability
Kamoa-Kakula recorded one lost time injury during Q1 2023 with a Total Recordable Injury Frequency Rate (TRIFR) (total injuries recorded per 1,000,000 hours worked) of 1.01.
The Platreef Project recorded zero lost time injuries in the quarter and reached 1,049,350 hours worked free of a lost-time injury with a TRIFR of 1.56, and the Kipushi Project also recorded zero lost time injuries in the quarter and reached 1,469,552 hours worked free of a lost-time injury with a TRIFR of 1.20.
Ivanhoe Mines published its sixth annual Sustainability Report on April 13, 2023, summarizing the Company’s sustainability activities, performance, and results for 2022 and underscoring its ongoing commitment to “mining with a greater purpose” and its pursuit to be a global leader of sustainable mining.
SELECTED QUARTERLY FINANCIAL INFORMATION
The following table summarizes selected financial information for the prior eight quarters. Ivanhoe had no operating revenue in any financial reporting period. All operating revenue from commercial production at Kamoa-Kakula is recognized within the Kamoa Holding joint venture. Ivanhoe did not declare or pay any dividend or distribution in any financial reporting period.
| Three months ended | |||||||||||
| March 31, 2023 | December 31, 2022 | September 30, 2022 | June 30, 2022 | ||||||||
| $’000 | $’000 | $’000 | $’000 | ||||||||
| Share of profit from joint venture | 82,659 | 83,324 | 34,057 | 49,690 | |||||||
| Finance income | 57,826 | 58,477 | 46,720 | 38,596 | |||||||
| Deferred tax recovery (expense) | 926 | (3,839 | ) | 4,252 | 114,184 | ||||||
| (Loss) gain on fair valuation of embedded derivative liability | (30,900) | (66,600 | ) | (27,700 | ) | 183,600 | |||||
| Finance costs | (10,465) | (10,457 | ) | (10,223 | ) | (10,013 | ) | ||||
| General administrative expenditure | (8,571) | (11,870 | ) | (9,199 | ) | (8,957 | ) | ||||
| Share-based payments | (7,702) | (7,809 | ) | (7,381 | ) | (4,637 | ) | ||||
| Exploration and project evaluation expenditure | (3,381) | (3,887 | ) | (4,312 | ) | (13,470 | ) | ||||
| Loss on fair valuation of financial asset | (1,595) | (1,170 | ) | (2,873 | ) | (2,942 | ) | ||||
| Profit (loss) attributable to: | |||||||||||
| Owners of the Company | 86,637 | 41,884 | 26,344 | 316,242 | |||||||
| Non-controlling interests | (4,157) | (4,705 | ) | (2,477 | ) | 35,278 | |||||
| Total comprehensive income (loss) attributable to: | |||||||||||
| Owners of the Company | 74,154 | 53,078 | 4,588 | 306,381 | |||||||
| Non-controlling interest | (5,420) | (3,621 | ) | (4,678 | ) | 34,495 | |||||
| Basic profit per share | 0.07 | 0.03 | 0.02 | 0.26 | |||||||
| Diluted profit per share | 0.07 | 0.03 | 0.02 | 0.26 | |||||||
| Three months ended | |||||||||||
| March 31, 2022 | December 31, 2021 | September 30, 2021 | June 30, 2021 | ||||||||
| $’000 | $’000 | $’000 | $’000 | ||||||||
| Share of profit (loss) from joint venture | 87,109 | 78,391 | 41,404 | (9,960 | ) | ||||||
| Finance income | 31,505 | 27,978 | 26,437 | 25,095 | |||||||
| (Loss) gain on fair valuation of embedded derivative liability | (66,400) | (88,500 | ) | 54,900 | (85,700 | ) | |||||
| Finance costs | (7,391) | (10,539 | ) | (10,451 | ) | (10,110 | ) | ||||
| Share-based payments | (7,389) | (7,490 | ) | (5,117 | ) | (4,068 | ) | ||||
| General administrative expenditure | (6,238) | (10,658 | ) | (6,731 | ) | (13,165 | ) | ||||
| Deferred tax (expense) recovery | (1,347) | 74,069 | (50 | ) | 978 | ||||||
| Profit (loss) attributable to: | |||||||||||
| Owners of the Company | 26,394 | 45,833 | 89,806 | (104,452 | ) | ||||||
| Non-controlling interests | (4,854) | 2,333 | (4,456 | ) | (4,161 | ) | |||||
| Total comprehensive income (loss) attributable to: | |||||||||||
| Owners of the Company | 45,495 | 29,774 | 72,470 | (92,793 | ) | ||||||
| Non-controlling interest | (2,858) | 632 | (6,277 | ) | (2,901 | ) | |||||
| Basic profit (loss) per share | 0.02 | 0.04 | 0.07 | (0.09 | ) | ||||||
| Diluted profit (loss) per share | 0.02 | 0.04 | 0.07 | (0.09 | ) | ||||||
DISCUSSION OF OPERATING RESULTS
Review of the three months ended March 31, 2023 vs. March 31, 2022
The Company recorded a profit for Q1 2023 of $82 million compared to a profit of $22 million for the same period in 2022. The total comprehensive income for Q1 2023 was $69 million compared to $43 million for Q1 2022.
The Kamoa-Kakula Copper Complex sold 86,777 tonnes of payable copper in Q1 2023 realizing revenue of $689 million for the Kamoa Holding joint venture, compared to 51,919 tonnes of payable copper sold for revenue of $520 million for the same period in 2022. The Company recognized income in aggregate of $130 million from the joint venture in Q1 2023, which can be summarized as follows:
| Three months ended | ||||||
| March 31, | ||||||
| 2023 | 2022 | |||||
| $’000 | $’000 | |||||
| Company’s share of profit from joint venture | 82,659 | 87,109 | ||||
| Interest on loan to joint venture | 47,592 | 28,289 | ||||
| Company’s income recognized from joint venture | 130,251 | 115,398 | ||||
The Company’s share of profit from the Kamoa Holding joint venture was $4 million less in Q1 2023 compared to the same period in 2022 and is broken down in the following table:
| Three months ended | ||||||
| March 31, | ||||||
| 2023 | 2022 | |||||
| $’000 | $’000 | |||||
| Revenue from contract receivables | 659,529 | 467,453 | ||||
| Remeasurement of contract receivables | 29,594 | 52,142 | ||||
| Revenue | 689,123 | 519,595 | ||||
| Cost of sales | (239,577 | ) | (123,370 | ) | ||
| Gross profit | 449,546 | 396,225 | ||||
| General and administrative costs | (30,646 | ) | (15,768 | ) | ||
| Amortization of mineral property | (2,596 | ) | – | |||
| Profit from operations | 416,304 | 380,457 | ||||
| Finance costs | (88,673 | ) | (54,643 | ) | ||
| Finance income and other | 110 | 5,504 | ||||
| Profit before taxes | 327,741 | 331,318 | ||||
| Current tax expense | (76,473 | ) | (5,215 | ) | ||
| Deferred tax (expense) recovery | (39,617 | ) | (104,829 | ) | ||
| Profit after taxes | 211,651 | 221,274 | ||||
| Non-controlling interest of Kamoa Holding | (44,663 | ) | (45,295 | ) | ||
| Total comprehensive income for the period | 166,988 | 175,979 | ||||
| Company’s share of profit from joint venture (49.5%) | 82,659 | 87,109 | ||||
The realized and provisional copper prices used for the remeasurement (mark-to-market) of contract receivables, can be summarized as follows.
| Three months ended | ||||||
| March 31, | ||||||
| 2023 | 2022 | |||||
| $’000 | $’000 | |||||
| Realized during the period – open at the start of the period | ||||||
| Open forward price(1) | 3.79 | 4.42 | ||||
| Realized price(1) | 4.07 | 4.51 | ||||
| Payable copper tonnes sold | 51,178 | 53,065 | ||||
| Remeasurement of contract receivables ($’000) | 32,625 | 11,057 | ||||
| Realized during the period – new copper sold in the current period | ||||||
| Provisional price(1) | 4.08 | – | ||||
| Realized price(1) | 4.01 | – | ||||
| Payable copper tonnes sold | 56,121 | – | ||||
| Remeasurement of contract receivables ($’000) | (8,551 | ) | – | |||
| Open at the end of the period – open at the start of the period | ||||||
| Opening forward price(1) | 3.79 | 4.40 | ||||
| Closing forward price(1) | 4.05 | 4.69 | ||||
| Payable copper tonnes sold | 6,625 | 36,920 | ||||
| Remeasurement of contract receivables ($’000) | 3,748 | 23,112 | ||||
| Open at the end of the period – new copper sold in current period | ||||||
| Provisional price(1) | 4.02 | 4.53 | ||||
| Closing forward price(1) | 4.05 | 4.69 | ||||
| Payable copper tonnes sold | 30,307 | 51,919 | ||||
| Remeasurement of contract receivables ($’000) | 1,772 | 17,973 | ||||
| Total remeasurement of contract receivables ($’000) | 29,594 | 52,142 | ||||
| (1) Calculated on a weighted average basis | ||||||
Of the $89 million (Q1 2022: $55 million) finance costs recognized in the Kamoa Holding joint venture for Q1 2023, $74 million (Q1 2022: $48 million) relates to shareholder loans where each shareholder funded Kamoa Holding in an amount equivalent to its proportionate shareholding interest before generating sufficient operational cashflow.
Of the remaining finance costs, $12 million (Q1 2022: $5 million) relates to the provisional payment facility available under Kamoa-Kakula’s offtake agreements, while $2 million (Q1 2022: $2 million) relates to the equipment financing facilities.
Exploration and project evaluation expenditure amounted to $3 million in Q1 2023 and $12 million for the same period in 2022. Exploration and project evaluation expenditure for Q1 2023 related to exploration at Ivanhoe’s Western Foreland exploration licences, while Q1 2022 also included amounts spent at the Kipushi Project, for which expenditure was capitalized in Q1 2023 due to the recommencement of the development of the project.
Finance income for Q1 2023 amounted to $58 million and was $26 million more than for the same period in 2022 ($32 million). Included in finance income is the interest earned on loans to the Kamoa Holding joint venture to fund past development which amounted to $48 million for Q1 2023, and $28 million for the same period in 2022, and increased due to the higher LIBOR rates and higher accumulated loan balance.
The Company recognized a loss on the fair valuation of the embedded derivative financial liability of $31 million for Q1 2023, compared to a loss on the fair valuation of the embedded derivative financial liability of $66 million for Q1 2023, which is further explained in the accounting for the convertible notes section on the Company’s MD&A for the three months ended 31 March, 2023.
Financial position as at March 31, 2023 vs. December 31, 2022
The company’s total assets increased by $94 million, from $3,969 million as at December 31, 2022, to $4,063 million as at March 31, 2023. The main reason for the increase in total assets was attributable to the increase in the company’s investment in the Kamoa Holding joint venture by $130 million and the increase in property, plant and equipment of $50 million as project development continued at the Platreef and Kipushi projects, which was partly offset by the decrease in cash and cash equivalents.
The company’s investment in the Kamoa Holding joint venture increased by $130 million from $2,047 million as at December 31, 2022, to $2,177 million as at March 31, 2023. The Company’s investment in the Kamoa Holding joint venture can be broken down as follows:
| March 31, | December 31, | |||||
| 2023 | 2022 | |||||
| $’000 | $’000 | |||||
| Company’s share of net assets in joint venture | 593,099 | 510,439 | ||||
| Loan advanced to joint venture | 1,584,193 | 1,536,601 | ||||
| Total investment in joint venture | 2,177,292 | 2,047,040 |
The company’s share of net assets in the Kamoa Holding joint venture can be broken down as follows:
| March 31, 2023 | December 31, 2022 | ||||||||||||
| 100% | 49.5% | 100% | 49.5% | ||||||||||
| $’000 | $’000 | $’000 | $’000 | ||||||||||
| Assets | |||||||||||||
| Property, plant and equipment | 2,975,903 | 1,473,072 | 2,733,176 | 1,352,922 | |||||||||
| Mineral property | 787,293 | 389,710 | 789,888 | 390,995 | |||||||||
| Cash and cash equivalents | 389,624 | 192,864 | 365,633 | 180,988 | |||||||||
| Indirect taxes receivable | 326,517 | 161,626 | 279,385 | 138,296 | |||||||||
| Other receivables | 296,171 | 146,604 | 212,221 | 105,049 | |||||||||
| Consumable stores | 288,248 | 142,683 | 257,434 | 127,430 | |||||||||
| Non-current inventory | 274,804 | 136,028 | 246,424 | 121,980 | |||||||||
| Long-term loan receivable | 257,041 | 127,235 | 252,523 | 124,999 | |||||||||
| Trade receivables | 59,553 | 29,479 | 63,196 | 31,282 | |||||||||
| Current inventory | 24,638 | 12,196 | 27,011 | 13,370 | |||||||||
| Right-of-use asset | 8,662 | 4,288 | 11,549 | 5,717 | |||||||||
| Prepaid expenses | 8,266 | 4,092 | 9,216 | 4,562 | |||||||||
| Non-current deposits | 1,872 | 927 | 2,272 | 1,125 | |||||||||
| Deferred tax asset | 665 | 329 | 710 | 351 | |||||||||
| Liabilities | |||||||||||||
| Shareholder loans | (3,199,499 | ) | (1,583,752 | ) | (3,103,381 | ) | (1,536,174 | ) | |||||
| Trade and other payables | (327,454 | ) | (162,090 | ) | (309,710 | ) | (153,306 | ) | |||||
| Deferred tax liability | (313,458 | ) | (155,162 | ) | (273,841 | ) | (135,551 | ) | |||||
| Equipment finance facility | (112,331 | ) | (55,604 | ) | (102,890 | ) | (50,931 | ) | |||||
| Income taxes payable | (65,986 | ) | (32,631 | ) | (14,600 | ) | (7,227 | ) | |||||
| Other provisions | (48,791 | ) | (24,152 | ) | (26,675 | ) | (13,204 | ) | |||||
| Rehabilitation provision | (45,162 | ) | (22,355 | ) | (45,231 | ) | (22,389 | ) | |||||
| Provisional payment facility | (42,607 | ) | (21,090 | ) | (38,866 | ) | (19,239 | ) | |||||
| Lease liability | (10,113 | ) | (5,006 | ) | (13,243 | ) | (6,555 | ) | |||||
| Non-controlling interest | (335,676 | ) | (166,160 | ) | (291,012 | ) | (144,051 | ) | |||||
| Net assets of the joint venture | 1,198,180 | 593,099 | 1,031,189 | 510,439 | |||||||||
Before commencing commercial production in July 2021, the Kamoa Holding joint venture principally used loans advanced to it by its shareholders to advance the Kamoa-Kakula Copper Complex through investing in development costs and other property, plant and equipment. No additional shareholder loans were advanced in 2022 or 2023 with joint venture cashflow funding its operations and expansions. The joint venture had a healthy cash position as at March 31, 2023, with cash and cash equivalents of $390 million on hand.
The Kamoa-Kakula’s Phase 1 and 2 operations are anticipated to generate significant operating cash flow to fund Phase 3 capital cost requirements at current copper prices and the joint venture is arranging short-term financing facilities should a shortfall occur due to a significant decrease in copper prices.
The cash flows of the Kamoa Holding joint venture can be summarized as follows:
| Three months ended | ||||||
| March 31, | ||||||
| 2023 | 2022 | |||||
| $’000 | $’000 | |||||
| Net cash generated from operating activities | 273,421 | 224,519 | ||||
| Net cash used in investing activities | (253,156 | ) | (107,016 | ) | ||
| Net cash generated from financing activities | 2,398 | 2,028 | ||||
| Effect of foreign exchange rates on cash | 1,328 | (1,567 | ) | |||
| Net cash inflow | 23,991 | 117,964 | ||||
| Cash and cash equivalents – beginning of the year | 365,633 | 22,031 | ||||
| Cash and cash equivalents – end of the period | 389,624 | 139,995 | ||||
The Kamoa Holding joint venture’s net increase in property, plant and equipment from December 31, 2022, to March 31, 2023, amounted to $243 million and can be further broken down as follows:
| Three months ended | ||||||
| March 31, | ||||||
| 2023 | 2022 | |||||
| $’000 | $’000 | |||||
| Kamoa Holding joint venture | ||||||
| Expansion capital | 209,824 | 106,611 | ||||
| Sustaining capital | 46,250 | 25,709 | ||||
| Initial capital | – | 9,009 | ||||
| 256,074 | 141,329 | |||||
| Depreciation capitalized | 8,401 | 2,556 | ||||
| Total capital expenditure | 264,475 | 143,885 | ||||
| Borrowing costs capitalized | 22,588 | 8,904 | ||||
| Total additions to property, plant and equipment for Kamoa Holding | 287,063 | 152,789 | ||||
| Less depreciation, disposals and foreign exchange translation | (44,336 | ) | (24,628 | ) | ||
| Net increase in property, plant and equipment of Kamoa Holding | 242,727 | 128,161 | ||||
Ivanhoe’s cash and cash equivalents decreased by $100 million, from $597 million as at December 31, 2022, to $497 million as at March 31, 2023. The Company spent $70 million on project development and acquiring other property, plant and equipment and used $24 million in its operating activities.
The net increase in property, plant and equipment amounted to $50 million, with additions of $74 million to project development and other property, plant and equipment. Of this total, $45 million pertained to development costs and other acquisitions of property, plant and equipment at the Platreef Project, while $28 million pertained to development costs and other acquisitions of property, plant and equipment at the Kipushi Project as set out below.
The main components of the additions to property, plant and equipment – including capitalized development costs – at the Platreef and Kipushi projects for the three months ended March 31, 2023, and for the same period in 2022, are set out in the following table:
| Three months ended | ||||||
| March 31, | ||||||
| 2023 | 2022 | |||||
| $’000 | $’000 | |||||
| Platreef Project | ||||||
| Phase 1 construction | 22,692 | 9,589 | ||||
| Phase 2 construction works | 10,346 | 2,256 | ||||
| Salaries and benefits | 3,407 | 3,053 | ||||
| Administrative and other expenditure | 1,924 | 1,224 | ||||
| Depreciation | 1,713 | 155 | ||||
| Site costs | 980 | 861 | ||||
| Studies and contracting work | 886 | 985 | ||||
| Social and environmental | 403 | 222 | ||||
| Total development costs | 42,351 | 18,345 | ||||
| Other additions to property, plant and equipment | 2,830 | 108 | ||||
| Total additions to property, plant and equipment for Platreef | 45,181 | 18,453 | ||||
| Three months ended | ||||||
| March 31, | ||||||
| 2023 | 2022 | |||||
| $’000 | $’000 | |||||
| Kipushi Project | ||||||
| Mine construction costs | 14,168 | – | ||||
| Salaries and benefits | 4,269 | 2,969 | ||||
| Administration and overheads | 2,995 | – | ||||
| Depreciation – development | 2,031 | – | ||||
| Electricity | 1,872 | 909 | ||||
| Studies and contracting work | 1,718 | 529 | ||||
| Other expenditure | 1,220 | 2,288 | ||||
| Other additions to property, plant and equipment | 200 | 295 | ||||
| Depreciation – exploration and project evaluation | – | 1,871 | ||||
| Total project expenditure | 28,473 | 8,861 | ||||
| Accounted for as follows: | ||||||
| Additions to property, plant and equipment | 14,368 | 295 | ||||
| Development costs capitalized to property, plant and equipment | 14,105 | – | ||||
| Exploration and project evaluation expenditure in the loss from operating activities | – | 8,566 | ||||
| Total project expenditure | 28,473 | 8,861 | ||||
The Company’s total liabilities increased by $18 million to $1,146 million as at March 31, 2023, from $1,128 million as at December 31, 2022, with the increase mainly due to the loss on the fair valuation of the embedded derivative liability of $31 million.
LIQUIDITY AND CAPITAL RESOURCES
The Company had $497 million in cash and cash equivalents as at March 31, 2023. At this date, the Company had consolidated working capital of approximately $514 million, compared to $595 million at December 31, 2022.
The Company’s planned capital expenditure for 2023 and 2024 can be summarized as follows:
| Capital Expenditure | Q1 2023 Actuals | 2023 Guidance | 2024 Guidance |
| ($’ million) | ($’ million) | ($’ million) | |
| Kamoa-Kakula | |||
| Phase 3 expansion | 142 | 1,400 – 1,800 | 1,100 – 700 |
| Phase 2 and other expansion capital | 68 | 120 | – |
| Sustaining capital | 46 | 180 | 80 |
| 256 | 1,700 – 2,100 | 1,180 – 780 | |
| Platreef | |||
| Phase 1 initial capital | 30 | 190 – 240 | 200 – 150 |
| Phase 2 capital | 13 | 60 | 40 |
| 43 | 250 – 300 | 240 – 190 | |
| Kipushi | |||
| Initial capital | 26 | 200 – 250 | 180 – 130 |
All capital expenditure figures are presented on a 100%-project basis.
The ranges provided reflect uncertainty in the timing of Kamoa-Kakula Phase 3 expansion, Platreef Phase 2 capital and Kipushi cash flows between calendar years 2023 and 2024. The 2024 capital expenditure guidance for Platreef and Kipushi excludes sustaining capital required in 2024 post-initial production.
As documented in the Kamoa-Kakula 2023 Integrated Development Plan (IDP 2023) announced on January 30, 2023, the remaining capital cost for the total Phase 3 expansion is estimated at $3.0 billion, including the mine, concentrator, smelter, infrastructure and investment in off-site hydropower infrastructure.
The Phase 1 and 2 operations are anticipated to generate significant operating cash flow in 2023 and 2024 and are expected to fund capital cost requirements at current copper prices. The joint venture had cash and cash equivalents of $390 million on hand at the end of March 2023.
Construction for Platreef’s Phase 1 Mine is underway, with the first production on track for Q3 2024. The planned Phase 2 capital expenditure at Platreef represents mainly the continuation of sinking Shaft 2 and the construction of the Shaft 2 headframe, as well as the initial optimization study at Platreef to potentially accelerate production from the Phase 2 expansion, which is currently under consideration.
Construction of the Kipushi Mine is also underway, with the processing plant scheduled for completion by Q3 2024. Long-lead equipment items have been ordered and manufacturing is underway, and earthworks and civil construction activities are taking place on the surface.
A tri-partite off-take and financing term sheet between Kipushi Corporation SA, Gécamines and Glencore has been signed to return the historic Kipushi zinc-copper-lead-germanium mine to production. The $250 million term financing facility will be split into two tranches and drawn down quarterly, subject to conditions precedent.
The facility will bear an annual interest rate of SOFR plus 7% and shall be repaid, following a 24- month grace period from signing, in quarterly installments over 36 months.
The off-take and financing term sheet is subject to the execution of final, binding agreements, which are expected to be concluded in conjunction with the new Kipushi joint-venture.
Exploration activities at the Western Foreland exploration project in the DRC, the Mokopane Feeder exploration project in South Africa and other targets will continue in 2023, with an initial budget of $31 million.
NON-GAAP FINANCIAL PERFORMANCE MEASURES
Kamoa-Kakula’s C1 cash costs and C1 cash costs per pound
C1 cash costs and C1 cash costs per pound are non-GAAP financial measures. These are disclosed to enable investors to better understand the performance of Kamoa-Kakula in comparison to other copper producers who present results on a similar basis.
C1 cash costs are prepared on a basis consistent with the industry standard definitions by Wood Mackenzie cost guidelines but are not measures recognized under IFRS.
In calculating the C1 cash cost, the costs are measured on the same basis as the Company’s share of profit from the Kamoa Holding joint venture that is contained in the financial statements. C1 cash costs are used by management to evaluate operating performance and include all direct mining, processing, and general and administrative costs. Smelter charges and freight deductions on sales to the final port of destination, which are recognized as a component of sales revenues, are added to C1 cash cost to arrive at an approximate cost of finished metal. C1 cash costs and C1 cash costs per pound exclude royalties and production taxes and non-routine charges as they are not direct production costs.
Reconciliation of Kamoa-Kakula’s cost of sales to C1 cash costs, including on a per pound basis:
| Three months ended | ||||||
| March 31, | ||||||
| 2023 | 2022 | |||||
| $’000 | $’000 | |||||
| Cost of sales | 239,577 | 123,370 | ||||
| Logistics, treatment and refining charges | 111,444 | 48,841 | ||||
| General and administrative expenditure | 30,646 | 15,768 | ||||
| Royalties and production taxes | (53,812 | ) | (28,576 | ) | ||
| Depreciation | (38,488 | ) | (15,236 | ) | ||
| Power rebate | (4,493 | ) | – | |||
| Movement in finished goods inventory | (688 | ) | 3 | |||
| General and administrative expenditure of other group entities | (324 | ) | (228 | ) | ||
| C1 cash costs | 283,862 | 143,942 | ||||
| Cost of sales per pound of payable copper sold ($ per lb.) | 1.25 | 1.08 | ||||
| C1 cash costs per pound of payable copper produced ($ per lb.) | 1.42 | 1.21 | ||||
| Payable copper produced in concentrate (tonnes) | 90,561 | 53,795 | ||||
Figures in the above table are for the Kamoa-Kakula joint venture on a 100% basis.
EBITDA, Adjusted EBITDA and EBITDA margin
EBITDA and Adjusted EBITDA are non-GAAP financial measures. Ivanhoe believes that Kamoa-Kakula’s EBITDA is a valuable indicator of the mine’s ability to generate liquidity by producing operating cash flow to fund its working capital needs, service debt obligations, fund capital expenditures and distribute cash to its shareholders.
EBITDA and Adjusted EBITDA are also frequently used by investors and analysts for valuation purposes. Kamoa-Kakula’s EBITDA and the EBITDA and Adjusted EBITDA for the Company are intended to provide additional information to investors and analysts and do not have any standardized definition under IFRS and should not be considered in isolation or as a substitute for measures of performance prepared per IFRS.
EBITDA and Adjusted EBITDA excludes the impact of cash costs of financing activities and taxes, and the effects of changes in operating working capital balances, and therefore are not necessarily indicative of operating profit or cash flow from operations as determined under IFRS. Other companies may calculate EBITDA and Adjusted EBITDA differently.
The EBITDA margin is an indicator of Kamoa-Kakula’s overall health and denotes its profitability, which is calculated by dividing EBITDA by revenue. The EBITDA margin is intended to provide additional information to investors and analysts, does not have any standardized definition under IFRS, and should not be considered in isolation, or as a substitute, for measures of performance prepared per IFRS.
Reconciliation of profit after tax to Kamoa-Kakula’s EBITDA:
| Three months ended | ||||||
| March 31, | ||||||
| 2023 | 2022 | |||||
| $’000 | $’000 | |||||
| Profit after taxes | 211,651 | 221,274 | ||||
| Finance costs | 88,673 | 54,643 | ||||
| Finance income | (5,076 | ) | (1,806 | ) | ||
| Current and deferred tax expense | 116,090 | 110,044 | ||||
| Depreciation | 41,084 | 15,236 | ||||
| EBITDA | 452,422 | 399,391 | ||||
Figures in the above table are for the Kamoa-Kakula joint venture on a 100% basis.
Reconciliation of profit after tax to Ivanhoe’s EBITDA and adjusted EBITDA:
| Three months ended | ||||||
| March 31, | ||||||
| 2023 | 2022 | |||||
| $’000 | $’000 | |||||
| Profit after taxes | 82,480 | 21,540 | ||||
| Finance income | (57,826 | ) | (31,505 | ) | ||
| Finance costs | 10,465 | 7,391 | ||||
| Current and deferred tax (recovery) expense | (881 | ) | 1,207 | |||
| Depreciation | 476 | 2,329 | ||||
| EBITDA | 34,714 | 962 | ||||
| Share of profit from joint venture net of tax | (82,659 | ) | (87,109 | ) | ||
| Company’s share of EBITDA from Kamoa-Kakula joint venture(1) | 178,857 | 158,136 | ||||
| Loss on fair valuation of embedded derivative liability | 30,900 | 66,400 | ||||
| Non-cash share-based payments | 6,538 | 6,253 | ||||
| Adjusted EBITDA | 168,350 | 144,642 | ||||
(1) The Company’s attributable share of EBITDA from the Kamoa-Kakula joint venture is calculated using the Company’s effective shareholding in Kamoa Copper SA (39.6%), Ivanhoe Mines Energy DRC SARL (49.5%), Kamoa Holding Limited (49.5%) and Kamoa Services (Pty) Ltd (49.5%).
Disclosure of technical information
Disclosures of a scientific or technical nature in this news release regarding the Kamoa-Kakula Copper Complex (other than stockpiles estimation), the Platreef Project and the Kipushi Project have been reviewed and approved by Steve Amos, who is considered, by virtue of his education, experience and professional association, a Qualified Person under the terms of NI 43-101. Mr. Amos is not considered independent under NI 43-101 as he is the Executive Vice President, Projects, at Ivanhoe Mines. Mr. Amos has verified the technical data related to the foregoing disclosed in this news release.
Disclosures of a scientific or technical nature regarding the Kamoa-Kakula stockpiles in this news release have been reviewed and approved by George Gilchrist, who is considered, by virtue of his education, experience and professional association, a Qualified Person under the terms of NI 43-101. Mr. Gilchrist is not considered independent under NI 43- 101 as he is the Vice President, Resources, at Ivanhoe Mines. Mr. Gilchrist has verified the technical data regarding the Kamoa-Kakula stockpiles disclosed in this news release.
Disclosures of a scientific or technical nature regarding the Western Foreland Project in this news release have been reviewed and approved by Stephen Torr, who is considered, by virtue of his education, experience and professional association, a Qualified Person under the terms of NI 43-101. Mr. Torr is not considered independent under NI 43-101 as he is the Vice President, Geosciences, at Ivanhoe Mines. Mr. Torr has verified the technical data regarding the Western Foreland Project disclosed in this news release.
Kamoa-Kakula 2023 IDP Technical Report dated March 6, 2023, prepared by OreWin Pty Ltd.; China Nerin Engineering Co. Ltd.; DRA Global; Epoch Resources; Golder Associates Africa; Metso Outotec Oyj; Paterson and Cooke; SRK Consulting Ltd.; and, The MSA Group.
The Kipushi 2022 Feasibility Study dated February 14, 2022, prepared by OreWin Pty Ltd., MSA Group (Pty) Ltd., SRK Consulting (South Africa) (Pty) Ltd, and METC Engineering.
The Platreef 2022 Feasibility Study dated February 28, 2022, prepared by OreWin Pty Ltd., Mine Technical Services, SRK Consulting Inc., DRA Projects (Pty) Ltd and Golder Associates Africa.
![]()