Kamoa-Kakula Project

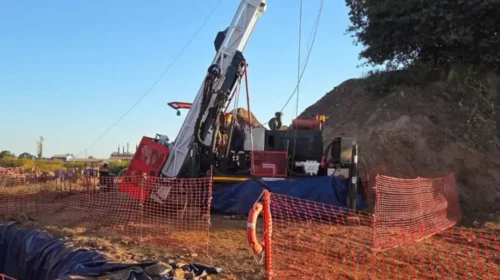
A member of Kakula’s future workforce, a miner trainee “operating” a piece of heavy equipment on a simulator at Kamoa-Kakula’s new training centre.
The Kamoa-Kakula Copper Project — a joint venture between Ivanhoe Mines (39.6%), Zijin Mining Group (39.6%), Crystal River Global Limited (0.8%) and the Government of the Democratic Republic of Congo (20%) — has been independently ranked as the world’s largest, undeveloped, high-grade copper discovery by international mining consultant Wood Mackenzie. It is a very large, near-surface, flat-lying, stratiform copper deposit with adjacent prospective exploration areas within the Central African Copperbelt, approximately 25 kilometres west of the town of Kolwezi and about 270 kilometres west of the provincial capital of Lubumbashi.
In February 2019, Ivanhoe Mines announced the positive findings of an independent pre-feasibility study (PFS) for the development of the Kakula copper mine and an updated, expanded preliminary economic assessment (PEA) for the overall development plan of the Kamoa and Kakula copper discoveries at the Kamoa-Kakula Project on the Central African Copperbelt, in the Democratic Republic of Congo (DRC). The PEA and PFS do not include any discoveries on Ivanhoe’s 100%-owned Western Foreland exploration licences that are adjacent to the Kamoa-Kakula Project.
The February 2019 PFS and updated PEA built on the outstanding results of the previous PEA announced in November 2017. The PFS has advanced the detailed design and engineering in that earlier study and has confirmed the viability of the project. As well, the re-scoped and expanded PEA shows the potential to develop the project to a larger scale and with a larger production capacity.
Construction of the Kakula Mine, the first of multiple, planned mining areas at Kamoa-Kakula, is making excellent progress. Initial copper concentrate production from the Kakula Mine is scheduled to begin in the third quarter of 2021. Following completion of basic engineering and procurement in Q3 2019, Kakula’s initial processing plant capacity was increased from 3.0 Mtpa to 3.8 Mtpa. The expansion in initial plant capacity requires increasing the underground mining crews in 2020 from 11 to 14 to ensure sufficient mining operations to feed the expanded plant and create pre-production stockpiles of approximately 1.5 million tonnes of high-grade ore and an additional 700,000 tonnes of material grading approximately 1% to 3% copper. This should allow the processing plant to ramp up quickly and maintain a steady-state throughput of 3.8 Mtpa.
An independent definitive feasibilty study (DFS) for the Kakula Mine, as well as an updated preliminary economic assessment (PEA) for the 18 Mtpa expanded production scenerio for the various mining areas discovered to date on the joint-venture licence area, including Kakula West, Kamoa and Kamoa North, is expected around the middle of 2020.

The PFS and PEA encompass two development scenarios:
- Pre-feasibility study for stage one Kakula mine development. The Kakula 2019 PFS evaluates the development of a stage one, 6 Mtpa underground mine and surface processing complex at the Kakula Deposit – a 2016 discovery that occurred just three years ago.
- Expanded, subsequent development to three producing mines. The Kamoa-Kakula 2019 PEA also includes an option for an integrated, 18 Mtpa, three-stage development, beginning with initial production from the Kakula Mine, to be followed by a subsequent, separate underground mining operation at the nearby Kansoko and Kakula West mines, along with the construction of a direct-to-blister smelter. A further four separate mines will be developed in the Kamoa North area as resources are mined out, to maintain the production rate at 18 Mtpa.
The Kakula 2019 PFS and Kamoa-Kakula 2019 PEA were independently prepared by Amec Foster Wheeler E&C Services Inc. (a division of Wood PLC) of Reno, USA; DRA Global of Johannesburg, South Africa; KGHM Cuprum R&D Centre Ltd. of Wroclaw, Poland; OreWin Pty Ltd. of Adelaide, Australia; Stantec Consulting International LLC of Arizona, USA, and SRK Consulting Inc. of Johannesburg, South Africa. All figures in the PFS and PEA are on a 100%-project basis unless otherwise stated.
The Kamoa-Kakula 2019 PEA is preliminary in nature and includes an economic analysis that is based, in part, on Inferred Mineral Resources. Inferred Mineral Resources are considered too speculative geologically for the application of economic considerations that would allow them to be categorized as Mineral Reserves – and there is no certainty that the results will be realized. Mineral Resources do not have demonstrated economic viability and are not Mineral Reserves.
HIGHLIGHTS
Initial 6 Mtpa mine at Kakula
- The Kakula 2019 PFS analyzes the development of an initial 6 Mtpa Kakula Mine at the Kakula Deposit in the southerly portion of the Kamoa-Kakula Project’s discovery area. For this option, the PFS envisages an average annual production rate of 291,000 tonnes of copper at a mine-site cash cost of US $0.46 per pound (lb) copper and total cash cost of US $1.11/lb copper for the first 10 years of operations, and copper annual production of up to 360,000 tonnes by year four.
- An initial capital cost of US $1.1 billion for this option would result in an after- tax net present value at an 8% discount rate (NPV8%) of US $5.4 billion . The internal rate of return of 46.9% and project payback period of 2.6 years confirm the compelling economics for the Kamoa-Kakula Project’s stage one of production.
- Kakula benefits from an ultra-high, average feed grade of 6.8% copper over the first five years of operations, and 5.5% copper on average over a 25-year mine life.
- Basic engineering is underway, expected to be completed around mid-year, running in parallel with a definitive feasibility study expected to be completed around year-end.
- Development of twin underground declines has been completed at Kakula, with ongoing underground development activities, including access drives and ventilation raises. In addition, a box cut for a ventilation decline on the southern side of the Kakula orebody is nearing completion.
Modular, integrated, expanded development option of Kakula and Kamoa deposits, mining a total of 18 Mtpa, with construction of a direct-to-blister smelter
- The Kamoa-Kakula 2019 PEA presents the alternative development option of a three-phase, sequential operation on Kamoa-Kakula’s high-grade copper deposits.
- Initial production would occur at a rate of 6 Mtpa from the Kakula Mine, before increasing to 12 Mtpa with mill feed from the Kansoko Mine. A third 6 Mtpa mine then will be developed at Kakula West, bringing total production rate to 18 Mtpa. As resources at Kakula and Kansoko are mined, the PEA envisages that production would begin at several mines in the Kamoa North area to maintain 18 Mtpa throughput over a 37-year mine life.
- For the three-phase sequential operation, the PEA envisages US $1.1 billion in initial capital costs. Future expansion at the Kansoko Mine, Kakula West Mine and subsequent extensions could be funded by cash flows from the Kakula Mine, resulting in an after-tax net present value at an 8% discount rate ( NPV8% ) of US $10.0 billion and an internal rate of return of 41%.
- Under this approach, the PEA also includes the construction of a direct-to-blister flash copper smelter at the Kakula plant site with a capacity of one million tonnes of copper concentrate per annum to be funded from internal cash flows. This would be completed in year five of operations, achieving significant savings in treatment charges and transportation costs.
- The 18 Mtpa scenario delivers average annual production of 382,000 tonnes of copper at a total cash cost of US $0.93/lb copper during the first 10 years of operations and production of 740,000 tonnes by year 12. At this future production rate, Kamoa-Kakula would rank as the world’s second largest copper mine.
Figure 1 describes the expanded development scenario for the Kamoa-Kakula 2019 PEA and Figure 2 shows an overview of deposits included within the Kakula 2019 PFS (6 Mtpa case), Kamoa 2019 PFS (6 Mtpa) and Kamoa-Kakula 2019 PEA (18 Mtpa). Additional exploration success at Kakula West, Kamoa North or regional exploration targets may have a significant, positive influence on the size, value and timing of the overall development plan.
Figure 1. Kamoa-Kakula 18 Mtpa PEA long-term development plan.

Figure 2. Overview of deposits included within the Kakula 2019 PFS (6 Mtpa – outlined in red box), Kamoa 2019 PFS (6 Mtpa – outlined in blue box) and Kamoa-Kakula 2019 PEA (outlined in green box).

Summary of the PFS ’s key results for an initial Kakula Mine
- Very-high-grade, stage-one production is projected to have a grade of 7.1% copper in the second year of production and an average grade of 6.4% copper over the initial 10 years of operations, resulting in estimated average annual copper production of 291,000 tonnes.
- Annual copper production is estimated at 360,000 tonnes in year four.
- Initial capital cost, including contingency, is estimated at US $1.1 billion.
- Average total cash cost of US $1.11/lb copper during the first 10 years, inclusive of royalties.
- After-tax NPV , at an 8% discount rate, of US $5.4 billion.
- After-tax internal rate of return ( IRR ) of 46.9%, and a payback period of 2.6 years.
- Kakula is expected to produce a very-high-grade copper concentrate in excess of 55% copper, with extremely low arsenic levels.
For additional details of Kakula 2019 PFS and Kamoa-Kakula 2019, please refer to Ivanhoe Mines February 6, 2019 news release.
Consolidated Kamoa and Kakula 2020 Mineral Resources
In February 2020, Ivanhoe announced an updated Indicated and Inferred Mineral Resource estimate for the Kamoa Deposit that includes resources in the new Kamoa North Bonanza Zond and the Kamoa Far North Zone. The new Kamoa Mineral Resource estimate has an effective date of January 30, 2020 and was prepared by George Gilchrist, Ivanhoe Mines’ Vice President, Mineral Resources, under the direction of Gordon Seibel, RM SME, of the Wood Group (formerly Amec Foster Wheeler), of Reno, USA , and is reported in accordance with the 2014 CIM Definition Standards for Mineral Resources and Mineral Reserves. Mr. Seibel is the Qualified Person for the estimate.
The project’s geological team also updated the Mineral Resource estimate for the Kakula Deposit. This updated estimate has an effective date of November 2018. Effective January 30, 2020, the total, combined Indicated and Inferred Mineral Resources for the Kamoa-Kakula Project is shown in Table 8. Tables showing the Indicated and Inferred Mineral Resources separately for the Kamoa and Kakula deposits, as well as the sensitivity of Mineral Resources to cut-off grade, are shown in the appendices to this release.
Table 8. Total Kamoa and Kakula Indicated and Inferred Mineral Resource (at 1% total copper cut-off grade).
| Deposit | Category | Tonnes (millions) |
Area (Sq. km) |
Copper Grade (%) |
Vertical Thickness (m) |
Contained Copper (kt) |
Contained Copper (billion lbs) |
| Kamoa | Indicated | 760 | 55.2 | 2.73 | 5.0 | 20,800 | 45.8 |
| Inferred | 235 | 21.8 | 1.70 | 4.0 | 4,010 | 8.8 | |
| Kakula | Indicated | 627 | 21.7 | 2.74 | 10.3 | 17,200 | 37.9 |
| Inferred | 104 | 5.6 | 1.61 | 6.7 | 1,680 | 3.7 | |
| Total Kamoa-Kakula Project | Indicated | 1,387 | 77.0 | 2.74 | 6.5 | 38,000 | 83.7 |
| Inferred | 339 | 27.4 | 1.68 | 4.5 | 5,690 | 12.5 |
Notes to accompany the total, combined Kamoa and Kakula January 2020 Mineral Resource table:
- Ivanhoe’s Vice President, Resources, George Gilchrist, a Fellow of the Geology Society of South Africa and Professional Natural Scientist (Pr. Sci. Nat) with the South African Council for Natural Scientific Professions (SACNASP), estimated the Kamoa Mineral Resources under the supervision of Gordon Seibel, a Registered Member (RM) of the Society for Mining, Metallurgy and Exploration (SME), an employee of Wood Group, who is the Qualified Person for the Mineral Resource estimate. The effective date of the estimate is January 30, 2020 and the cut-off date for drill data is January 20, 2020. Mineral Resources are estimated using the CIM 2014 Definition Standards for Mineral Resources and Mineral Reserves. Mineral Resources are reported inclusive of Mineral Reserves on a 100% basis.
- Mineral Resources are reported using a total copper (TCu) cut-off grade of 1% TCu and a minimum vertical thickness of 3 m. There are reasonable prospects for eventual economic extraction under assumptions of a copper price of US$3.00/lb, employment of underground mechanized room-and-pillar and drift-and-fill mining methods, and that copper concentrates will be produced and sold to a smelter. Mining costs are assumed to be US$27/t. Concentrator, tailings treatment, and general and administrative costs (G&A) are assumed to be US$17/t. Metallurgical recoveries are expected to average 84% (86% for hypogene and 81% for supergene). At a 1% TCu cut-off grade, assumed net smelter returns for 100% of Mineral Resource blocks will cover processing, tailings treatment and G&A costs.
- Reported Mineral Resources contain no allowances for hanging wall or foot wall contact boundary loss and dilution. No mining recovery has been applied.
- Depth of mineralization below the surface ranges from 10 m to 1,320 m for Indicated Mineral Resources and 20 m to 1,560 m for Inferred Mineral Resources.
- Approximate drill-hole spacings are 800 m for Inferred Mineral Resources and 400 m for Indicated Mineral Resources.
- The average dip of the deposit within the Indicated and Inferred Mineral Resource outlines is 12.7 degrees. Vertical thickness approximates true thickness at Kamoa.
- Rounding as required by reporting guidelines may result in apparent summation differences between tonnes, grade and contained metal content.
- Ivanhoe’s Vice President, Resources, George Gilchrist, a Fellow of the Geology Society of South Africa and Professional Natural Scientist (Pr. Sci. Nat) with the South African Council for Natural Scientific Professions (SACNASP), estimated the Kakula Mineral Resources under the supervision of Gordon Seibel, a Registered Member (RM) of the Society for Mining, Metallurgy and Exploration (SME), an employee of Wood Group, who is the Qualified Person for the Mineral Resources. The effective date of the estimate for Kakula is November 10, 2018, and the cut-off date for the drill data is November 1, 2018. Mineral Resources are estimated using the CIM Definition Standards for Mineral Resources and Reserves (2014) and reported on a 100% basis. Mineral Resources are reported inclusive of Mineral Reserves on a 100% basis.
- Mineral Resources are reported using a total copper (TCu) cut-off grade of 1% TCu and an approximate minimum thickness of 3 m. There are reasonable prospects for eventual economic extraction under assumptions of a copper price of US$3.00/lb, employment of underground, mechanized, room-and-pillar and drift-and-fill mining methods, and that copper concentrates will be produced and sold to a smelter. Mining costs are assumed to be US$42/t. Concentrator, tailings treatment and general and administrative (G&A) costs are assumed to be US$18/t. Metallurgical recovery is assumed to average 85%. Ivanhoe is studying reducing mining costs using a controlled convergence room-and-pillar method. At a 1% TCu cut-off grade, assumed net smelter returns for 100% of Mineral Resource blocks will cover concentrator, tailings treatment and G&A costs.
- Reported Mineral Resources contain no allowances for hanging wall or footwall contact boundary loss and dilution. No mining recovery has been applied.
- Approximate drill-hole spacings are 800 m for Inferred Mineral Resources and 400 m for Indicated Mineral Resources.
- The average dip of the deposit within the Indicated and Inferred Mineral Resource outlines is 17.8 degrees. Vertical thickness approximates true thickness at Kakula.
- Rounding as required by reporting guidelines may result in apparent differences between tonnes, grade and contained metal content.
Kakula 2019 PFS Mineral Reserve
The Kakula 2019 PFS Mineral Reserve has been estimated by Qualified Person Jon Treen, Senior Vice President, Stantec Consulting International LLC , using the 2014 CIM Definition Standards for Mineral Resources and Mineral Reserves to conform to the Canadian National Instrument 43-101 Standards of Disclosure for Mineral Projects. The total Mineral Reserve for the Kakula Project is shown in Table 9. The Mineral Reserve is based on the April 2018 Mineral Resource. The Mineral Reserve is entirely a Probable Mineral Reserve that was converted from Indicated Mineral Resources. The effective date of the Mineral Reserve statement is February 1, 2019.
Table 9. Kakula 2019 PFS Mineral Reserve Statement.
| Tonnage (Mt) |
Copper (%) |
Copper (Contained Mlb) |
Copper (Contained kt) |
||
| Proven Mineral Reserve | – | – | – | – | |
| Probable Mineral Reserve | 119.7 | 5.48 | 14,475 | 6,566 | |
| Mineral Reserve | 119.7 | 5.48 | 14,475 | 6,566 |
Notes to accompany Kakula 2019 PFS Mineral Reserve table
- The copper price used for calculating the financial analysis is long-term copper at US$3.10/lb. The analysis has been calculated with assumptions for smelter refining and treatment charges, deductions and payment terms, concentrate transport, metallurgical recoveries, and royalties.
- For mine planning, the copper price used to calculate block model Net Smelter Returns (NSRs) was US$3.00/lb.
- An elevated cut-off of US$100.00/t NSR was used to define the stoping blocks. A marginal cut-off of US$80.00/t NSR was used to define ore and waste.
- Indicated Mineral Resources were used to report Probable Mineral Reserves.
- Tonnage and grade estimates include dilution and recovery allowances.
- The Mineral Reserves reported above are not additive to the Mineral Resources.
The Kakula 2019 PFS Mineral Reserve targeted in the mine plan focused on maximizing the grade profile for a 6 Mtpa full production rate for 15 years, a five-year ramp-up, plus an 85% extraction and recovery allowance. As such, a range of NSR cut-offs were evaluated that identified a targeted resource of approximately 125 million tonnes at the highest NSR
Tonnes and grades were calculated for the mining blocks, and allowances for unplanned dilution and mining recovery were applied to estimate the Mineral Reserve Statement.
Click here to view the full technical report titled: Kamoa-Kakula 2018 Resource Update, March 2018
Click here to view the Kakula 2016 Preliminary Economic Assessment, January 2017
As Ivanhoe Mines and its joint-venture partner, Zijin Mining, continue to advance construction of the Kakula Copper Mine in the Democratic Republic of Congo, Ivanhoe is pleased to present a short, animated video showing the planned development for the six-million-tonne-per-annum (6 Mtpa) underground mine and surface processing facilities.
The Kamoa-Kakula Project transforms local communities through sustainable agriculture, fish-farming and employment opportunities. Watch the video below to learn more about the Kamoa-Kakula Sustainable Livelihoods Program.
In March 2015, Ivanhoe’s exploration team received the 2015 PDAC Thayer Lindsley International Discovery Award for Kamoa
Enjoy the read and the details.